Help: Team Engagement Report
The Team Engagement Report helps leaders understand who is participating, how they are contributing, and what value is being created through ideas and projects in KPI Fire.
This report answers three key questions:
- Who is actively engaged?
- How are people contributing?
- Is that work producing measurable results?
Summary Metrics
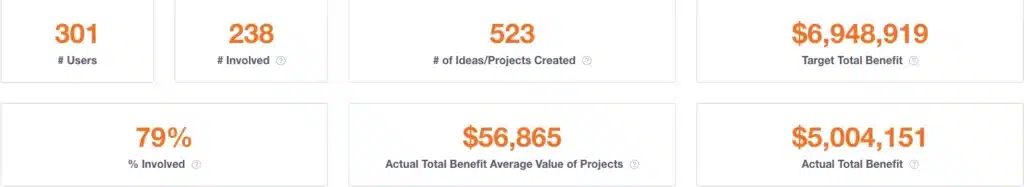
At the top of the report you’ll see high-level metrics that summarize engagement across your organization or selected filters.
What these mean:
- # Users – Total number of users. Includes all user license types, active, or inactive.
- # Involved – Number of users who have participated in at least one idea or project
- # of Ideas / Projects Created – Total volume of improvement activity
- Target Total Benefit – Sum of Project Target Benefits. All Years
- Actual Total Benefit – Sum of Actual Total Benefits
- % Involved – Percentage of users actively participating
💡 Use this section to quickly assess overall adoption and participation.
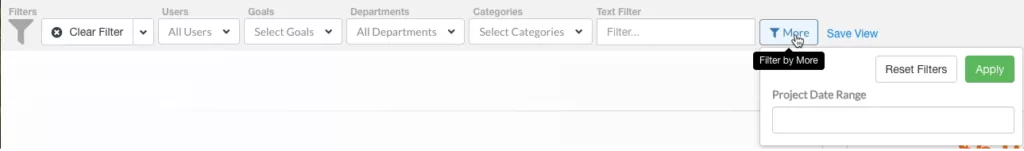
Global Filters
Filters allow you to narrow the report to exactly what you want
- Users Filter:
- default is all active users.
- Inactive users will not be displayed
- Goal Filter: Default value: No goal selected.
- Goal Year: is part of goal filter
- Department
- May be limited for users by admin based on user license type.
- Categories
- Text Filter
- More Filter Options:
- Project Date Range: based on the Target & Actual Start and End date in the project charter.
Note: This is different dates than the Project Benefit Dates.
Column Header Filters
Light blue color indicates a filter is active.
- User Name
- User Department
- Certification Level