Free Fishbone Diagram – Ishikawa Templates
Free Fishbone Diagram and Root Cause Analysis Templates
Identify the real cause of problems using Fishbone, 5 Whys, and Is/Is Not tools. Download the Excel templates to:
- Analyze process variation
- Identify Lean waste
- Find root causes with your team

Download includes:
✔ Fishbone Diagram – 6Ms (Sources of Variation)
Categorize causes under Man, Machine, Method, Material, Measurement System, and Mother Nature.
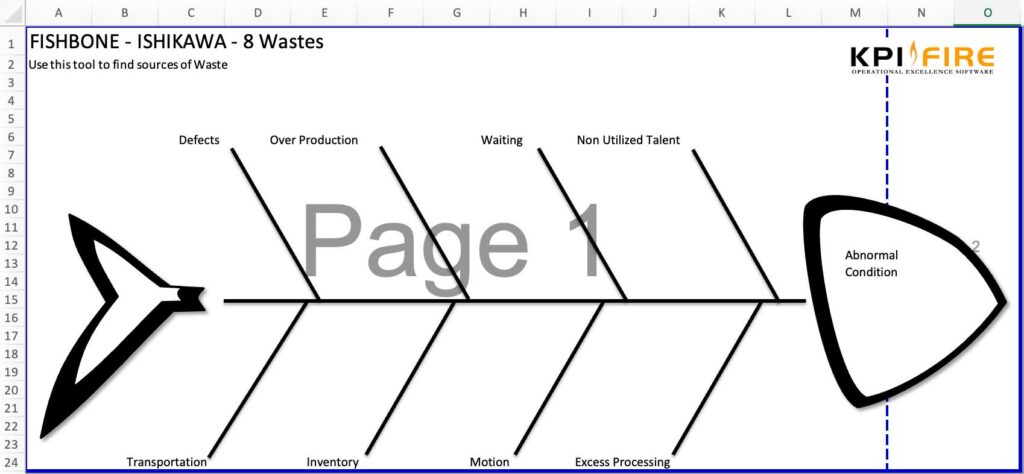
✔ Fishbone Diagram – 8 Wastes (Lean Waste Tool)
Analyze causes using Lean Waste categories: Defects, Overproduction, Waiting, Inventory, Motion, Excess Processing, Non-Utilized Talent, Transportation.
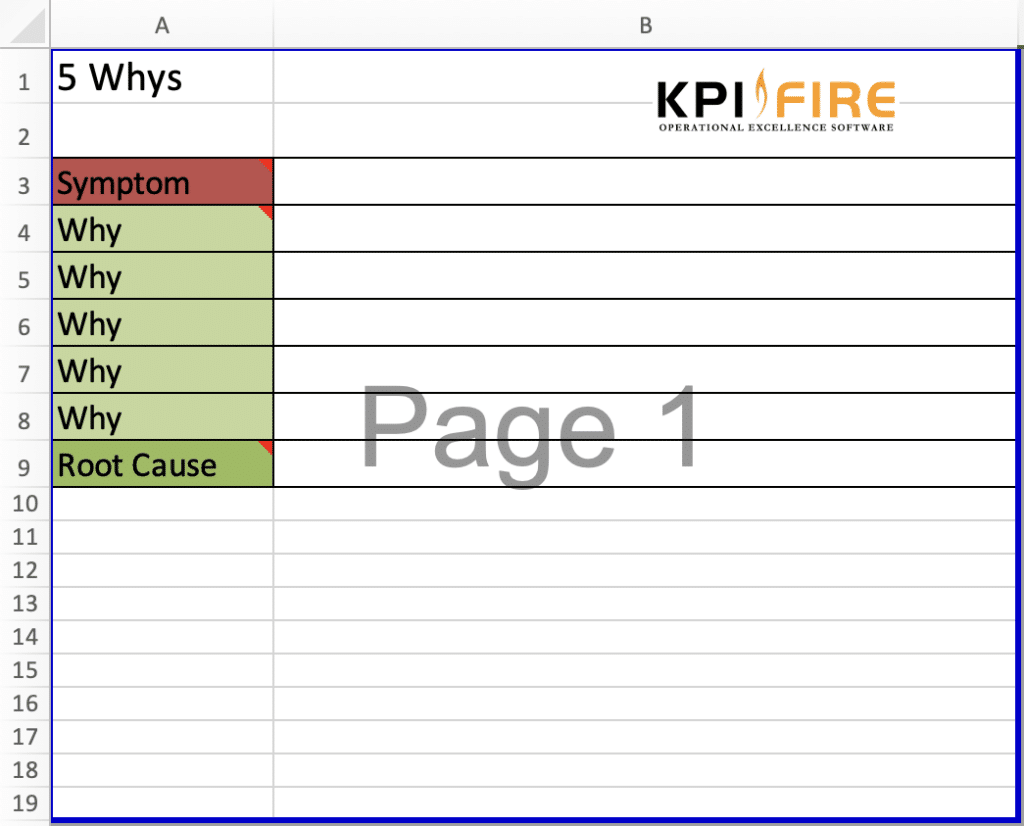
✔ 5 Whys Worksheet
Simple structured table to dig deeper into a symptom by asking “Why?” until the root cause is found.
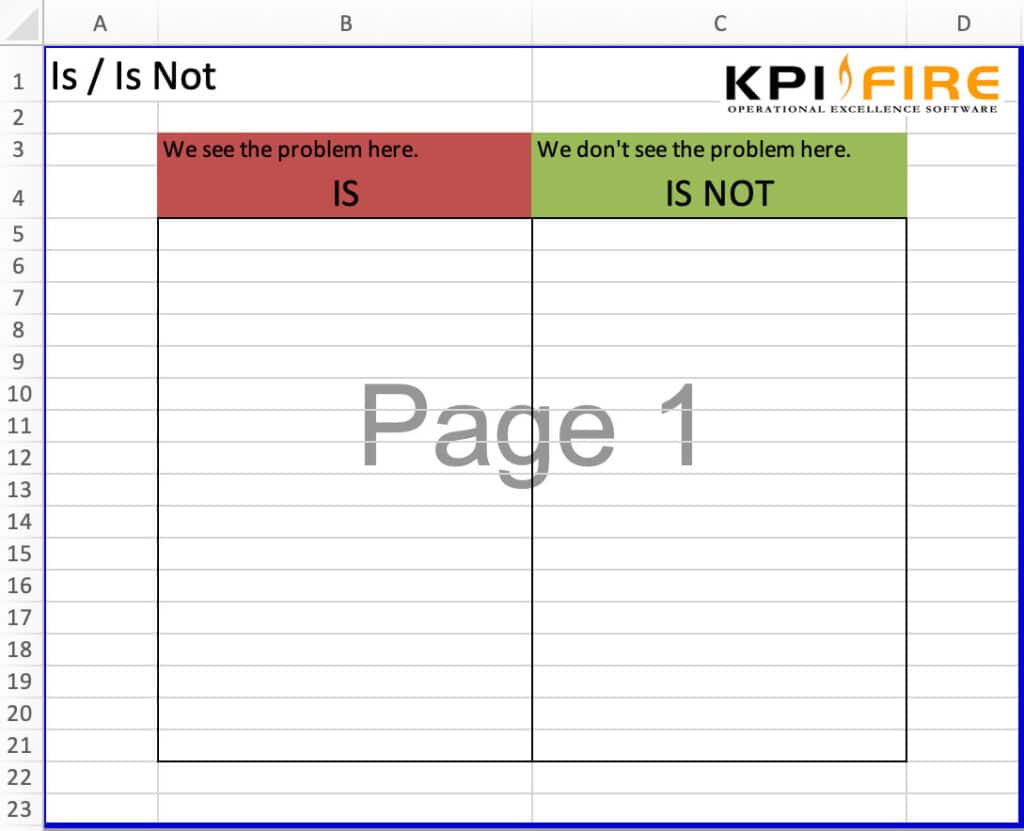
✔ Is / Is Not Analysis
A problem-definition tool to clarify where the issue occurs vs where it does not.
✔ Format: Editable Excel + Printable PDF
No credit card required. Instant access.
What Is a Fishbone Diagram?
The Fishbone Diagram, also called the Ishikawa or Cause and Effect Diagram, helps you visually map out all possible causes of a problem so you can identify the true source and fix it for good.
Use it to:
- Stop repeated mistakes
- Clarify cause and effect relationships
- Support Lean, Six Sigma, and Continuous Improvement efforts
- Improve collaboration during problem-solving workshops
How to Use the Template
-
Start with the Problem Statement
Write the symptom or issue at the head of the Fishbone diagram or at the top of the 5 Whys sheet. -
Choose a Tool Based on Your Needs
• Use Fishbone 6Ms to explore process variation
• Use Fishbone 8 Wastes to identify Lean waste
• Use 5 Whys to dig deeper into one cause
• Use Is / Is Not to clarify and narrow problem boundaries -
Brainstorm Causes with Your Team
Add possible causes to each category. -
Identify the True Root Cause and Next Actions
Use your findings to assign corrective actions or create a project in KPI Fire.
Who Should Use Fishbone Diagram – Ishikawa Templates?
This template is ideal for:
- Lean practitioners
- Quality managers
- Six Sigma teams
- Supervisors
- Manufacturing leaders
And anyone who needs to find and eliminate the cause of recurring problems.
About KPI Fire
KPI Fire helps organizations Align Strategy, Drive Execution, and Engage People.
Our software includes built-in templates for Hoshin Kanri, X-Matrix, OKRs, A3s, DMAIC, and more, helping teams stay aligned and achieve more.

Turn Ideas into Measurable Business Results – Book Your Free Demo Today!
Join world-class companies that have tracked and saved over $1.4 Billion with KPI Fire.
- Track Cost Savings & ROI in Real Time
- Align Strategy with KPI Metrics
- Drive Execution & Engage Teams
Schedule a 30-minute demo to discover how KPI Fire can boost your business.