Free Fishbone Diagram – Ishikawa Templates
Free Fishbone Diagram Template Excel: Root Cause & Ishikawa Worksheet
Stop chasing localized operational symptoms. Download our multi-tool, Lean-optimized Excel toolkit to visually isolate process variations, map cause-and-effect relationships, and find true root causes with your team on a single interface.
The Fishbone Diagram Template includes:
- Pre-Built Ishikawa 6M’s Engine
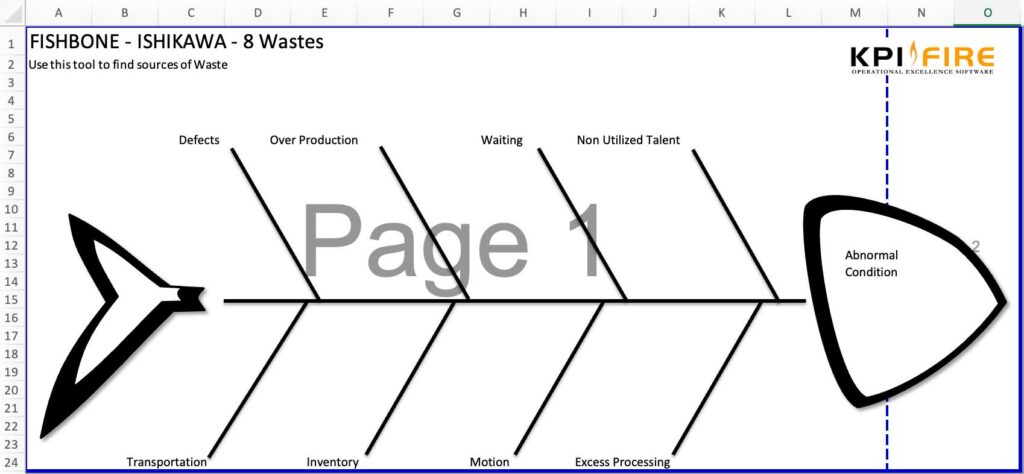
- 8 Wastes Root-Cause View
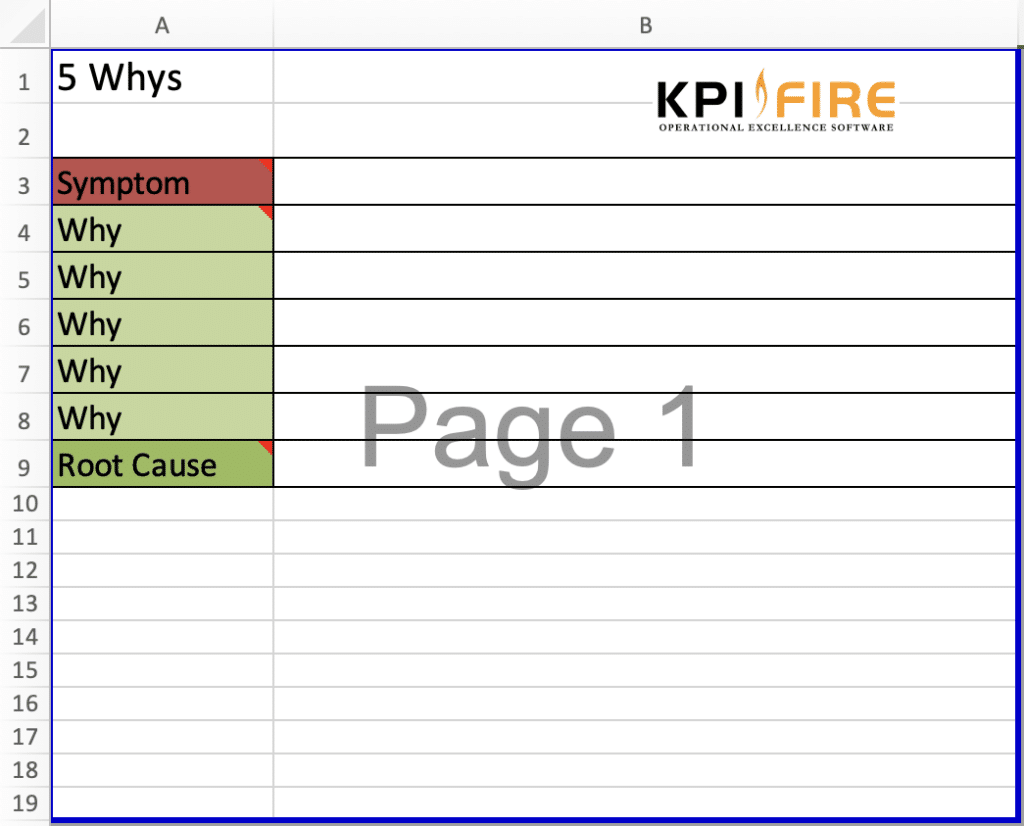
- Cascading 5 Whys Worksheet
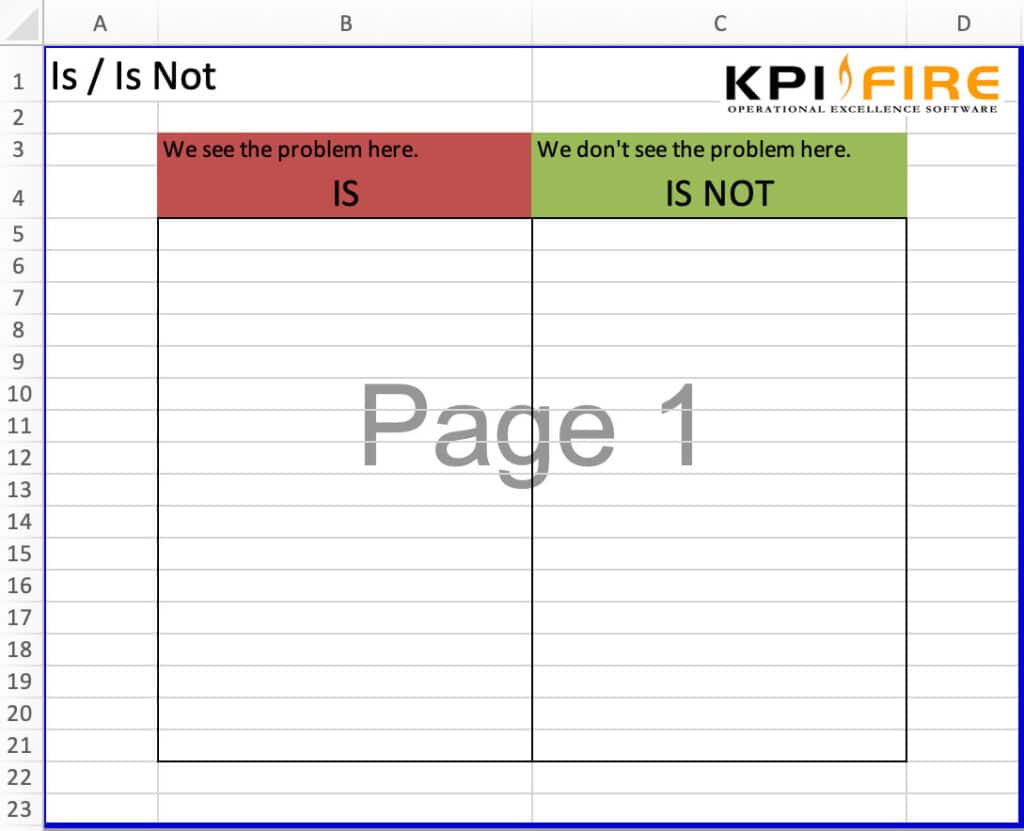
- Is / Is Not Problem Boundaries

Move from Quick-Fix Patching to Permanent Cause and Effect Elimination
When a high-impact error or unexpected variation slows down an enterprise process, busy teams frequently patch the visual surface symptom rather than treating the underlying mechanism. This reactive “firefighting” pattern guarantees that operational defects, delays, and capacity bottlenecks will consistently reappear during production cycles. A disciplined, team-based cause-and-effect diagram strips away speculation, organizing institutional knowledge into clear, logical paths so engineering and operational leaders can target the correct structural variables.
The 3-Bullet Core Value Framework Baseline
1. Multi-Dimensional Diagnostics: Seamlessly switch between classical variation grouping (6M’s) for manufacturing anomalies and operational waste grouping (8 Wastes) for transactional pipeline friction.
2. Granular Process Isolation: Clear visual layouts isolate weak interaction layers between equipment calibrations, training protocols, raw material consistency, and measurement systems.
3. Seamless Action Translation: Transition from high-level team brainstorming notes directly into structured corrective workflows, completely eliminating information loss across disconnected systems.
Everything You Need to Master Root Cause Analysis
Ishikawa 6M's Variation Diagram
Read More...Master classical process variation analysis. Group potential failure vectors into six distinct branches: Manpower, Machinery, Methods, Materials, Measurements, and Mother Nature to map every variable clearly.
Deep-Dive 5 Whys Linear Logic
Read More...Move downstream from a fishbone branch to final root causes. Use a clean, step-by-step table built to systematically document logic chains and isolate true failure modes from superficial symptoms.
8 Wastes Fishbone Worksheet
Read More...Run targeted, high-efficiency Lean workshops. This custom layout maps your process problems directly against the 8 core wastes, such as Overproduction, Defects, Waiting, and Non-Utilized Talent, to surface hidden bottlenecks.
Is / Is Not Problem Definition Sheet
Read More...Define sharp problem scopes before starting workshops. This workspace separates facts from assumptions by documenting where a problem manifests versus where it could show up but does not.
Static Visual Sheets Can Find Problems. They Can’t Drive Corrective Tracking.
An Excel-based fishbone diagram is perfect for running an initial problem-solving workshop with an immediate team. However, once the primary root cause is discovered, static spreadsheets cannot actively assign tracking tasks, do not integrate with live corporate dashboard metrics, and fail to prevent tracking actions from slipping through the cracks of a busy work week. To transform continuous improvement exercises into verified financial value, organizations must bridge the gap between initial root cause diagnostics and active project management.
Turn Ideas into Measurable Business Results — Book Your Free Demo Today!
Join premier global enterprises that have standardized problem-solving, tracked improvements, and saved over $1.4 Billion inside KPI Fire.
Value Checkmarks:
- Embed Live Fishbone, A3, and 5 Whys Workspaces Directly Into Team Workflows
- Track Real-Time Project Implementation ROI and Hard Financial Savings
- Automatically Escalate Root-Cause Action Items to Centralized Leadership Dashboards
Book a quick, tailored 30-minute workspace review to see how KPI Fire digitizes your problem-solving frameworks and coordinates project tracking.

Turn Ideas into Measurable Business Results – Book Your Free Demo Today!
Join world-class companies that have tracked and saved over $1.4 Billion with KPI Fire.
- Track Cost Savings & ROI in Real Time
- Align Strategy with KPI Metrics
- Drive Execution & Engage Teams
Schedule a 30-minute demo to discover how KPI Fire can boost your business.