How to Use Pareto Feature in KPI Fire
Pareto Analysis is a powerful problem-solving technique that helps you identify the key factors contributing to most of your results — both good and bad. In KPI Fire, the Pareto Feature makes it easy to visualize these insights directly within your metrics.
What is the Pareto Principle?
You may have heard of the Pareto Principle, often summarized as the 80/20 rule — the idea that 80% of outcomes come from 20% of causes. In practical terms, this means that focusing on the most significant few issues can often yield the biggest improvements.
In the past, creating Pareto charts required extra effort and manual setup. KPI Fire makes it simple.
KPI Fire’s Pareto Feature automates this process so you can quickly see which factors have the greatest impact and prioritize your improvement efforts accordingly.
How to Use the Pareto Feature
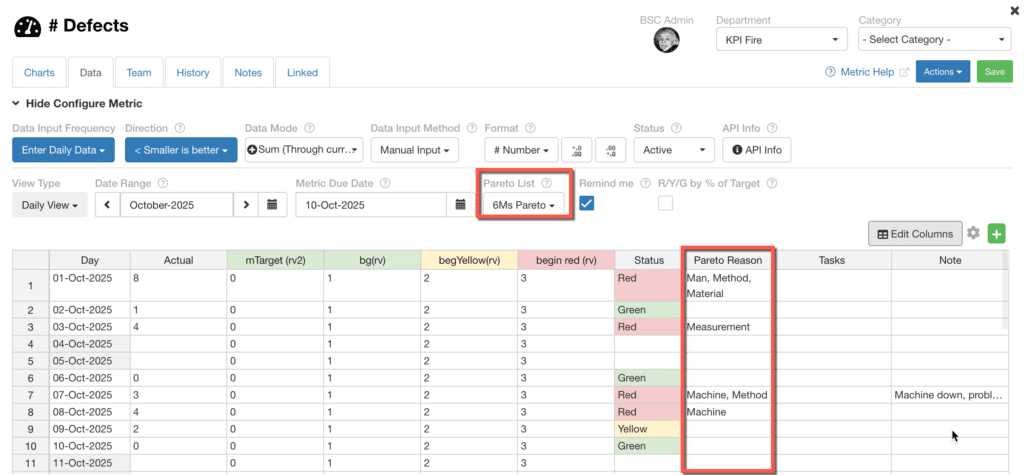
Every Metric in KPI Fire includes a Reason Code column designed specifically for Pareto Analysis.
If your metric interval is Red or Yellow, ask: Why did we miss the target? The answer to this question is your Pareto Reason, or Reason Code.
Each entry in this column represents a category of defect or cause contributing to the metric’s results. KPI Fire uses these reason codes to automatically generate your Pareto chart.
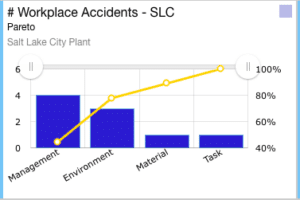
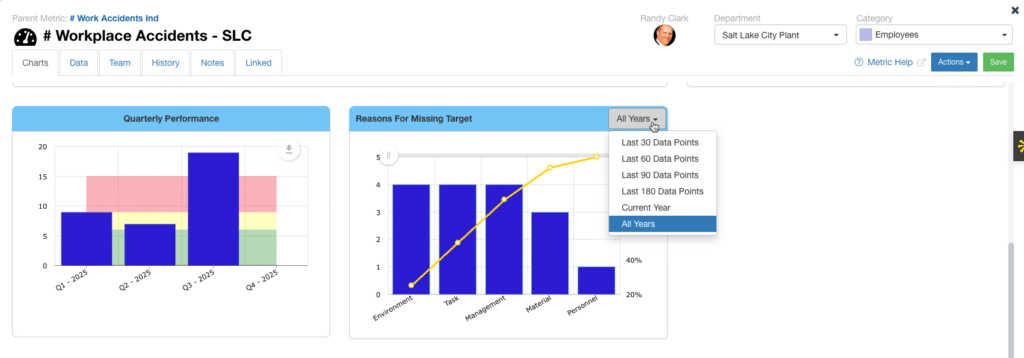
Viewing the Pareto Chart
You can view a Pareto chart in two places:
-
On the Metric → Charts tab
-
As a Pareto Tile added to a Custom Huddle board

Pareto Lists
Pareto Lists are sets of predefined categories (reason codes) used for Pareto Analysis.
They ensure consistency across metrics and make it easy to compare similar data.
-
Pareto Lists are associated with Metrics.
-
They are managed by Admin Users.
-
Each metric can share a common Pareto List or have its own custom list.
Linking a Pareto List to a Metric
To connect a Pareto List to a metric:
-
Open the desired Metric.
-
Go to the Data tab.
-
Select the appropriate Pareto List from the dropdown
Admin users can create and manage Pareto Lists by navigating to:
Account Settings → General Settings → Categories/Tags/Pareto/Custom Fields → Pareto
Adding a Pareto Chart to a Huddleboard
You can display a Pareto chart directly on your Huddleboard for quick visibility.
-
Open a Custom Huddleboard.
-
Click Add New Tile.
-
Choose Metric: Pareto.
-
Select the metric you want to display.
Your Pareto Chart tile will now appear on the board, automatically updating with new data.
Locking Pareto Values
Admin users can lock values in a Pareto List to prevent metric users from adding new or inconsistent values.
This helps maintain data integrity and ensures consistent analysis across the organization.
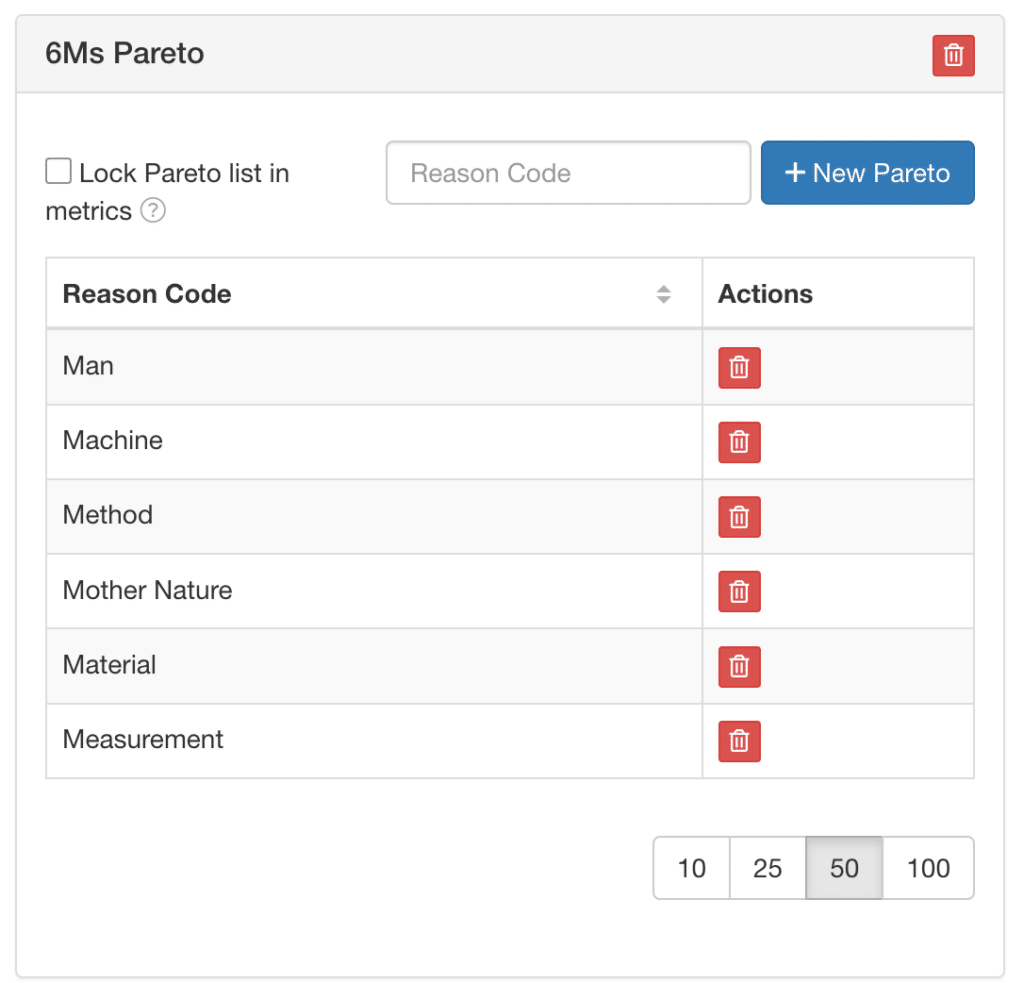
The 6 Ms of Pareto Analysis
The 6 Ms are a classic framework used in Root Cause Analysis and Fishbone (Ishikawa) Diagrams.
They represent six categories of potential causes that can contribute to variation or defects in a process.
Using the 6 Ms helps teams systematically brainstorm and group causes before prioritizing them with a Pareto Chart.
1. Man (People)
Human-related factors — how people perform the work.
Examples:
-
Lack of training
-
Fatigue or stress
-
Poor communication
-
Operator error
-
Inadequate supervision
⚙️ 2. Machine (Equipment)
Mechanical or equipment-related causes.
Examples:
-
Equipment malfunction
-
Poor maintenance
-
Outdated technology
-
Tool wear or incorrect setup
-
Calibration errors
🧪 3. Material
Issues related to the inputs used in the process.
Examples:
-
Defective raw materials
-
Inconsistent material quality
-
Wrong material specification
-
Contamination
-
Poor storage conditions
🧭 4. Method
How the process is carried out — the procedures or techniques used.
Examples:
-
Inconsistent work instructions
-
Lack of standardization
-
Poor process design
-
Inefficient workflow
-
Skipped steps or shortcuts
🌡️ 5. Measurement
Errors or variation in how results are measured.
Examples:
-
Inaccurate instruments
-
Wrong data collection methods
-
Human error in recording data
-
Lack of calibration or validation
-
Misinterpretation of metrics
🌍 6. Mother Nature (Environment)
External or environmental conditions that affect the process.
Examples:
-
Temperature or humidity variations
-
Lighting, noise, or dust
-
Seasonal effects
-
Work environment ergonomics
-
Power fluctuations
Summary
The Pareto Feature in KPI Fire helps you:
-
Identify and visualize key problem areas
-
Apply the 80/20 principle to focus improvement efforts
-
Use structured lists and charts to standardize analysis
-
Leverage the 6 Ms framework for better root cause discovery
By combining the simplicity of KPI Fire with the rigor of Pareto Analysis, you can guide your team toward data-driven continuous improvement.