Free Project Benefits Calculator Template: Turn Process Improvements into Measurable Cost Savings
Stop leaving project value to chance. Use our Lean-optimized Excel template to quantify the financial impact of your initiatives and secure executive buy-in.

Stop Guessing the Value of Your Improvements
Many Project Managers struggle to communicate “Soft Savings” like time or efficiency in a way that Finance understands. Our template uses the 8 Wastes framework to translate operational changes into hard financial data. Without a clear financial model, improvement projects risk being undervalued or cut entirely during budget review
Built on Results
This framework helps organizations move beyond simple tracking to true benefit realization.
-
- Proven Impact: Join world-class organizations that have tracked over $1.4 Billion in savings using this logic across manufacturing, healthcare, and enterprise operations.
- Standardized Logic: Built using industry benchmarks for labor rates, material costs, and capital efficiency.
This is the very same project Benefits Excel Template that Cedro Toro (Master Black Belt) uses as part of his Green Belt Training to teach how to calculate project benefits. This worksheet template will help you quantify simple changes in factors such as a reduction in defects and how to turn that into hard and soft savings for the organization.
Everything You Need to Prove Project Value
Waste-to-Value Conversion
Read More...Turn the “8 Wastes” (Defects, Overproduction, Waiting, Non-Utilized Talent, Transportation, Inventory, Motion, Excess Processing) into specific, defensible dollar amounts.
Interactive Project Dashboard
Read More...View an automated summary of your total project impact across every category in one professional report.
Hard vs. Soft Savings Tracking
Read More...Clearly distinguish between bottom-line cash savings and efficiency gains that free up organizational capacity.
Pre-Built Industry Benchmarks
Read More...Access standardized rates for labor, physician time, and floor space to ensure your calculations are accurate and credible.
Spreadsheets Work for One Project. Not for a Program.
Manage Lean / 6 Sigma, Continuous Improvement Projects with KPI Fire Software. KPI Fire is a software that can manage your continuous improvement projects and track project benefits. This template is ideal for getting started but as your number of improvement projects grows, tracking benefits across teams becomes difficult.
KPI Fire helps you:
- Track project benefits across your entire portfolio
- Validate savings with finance-approved workflows
- Eliminate spreadsheet version control issues
- Create a single source of truth for cost savings
Check out this video to see how KPI Fire manages Projects & Project Savings.
Frequently Asked Questions (FAQs)

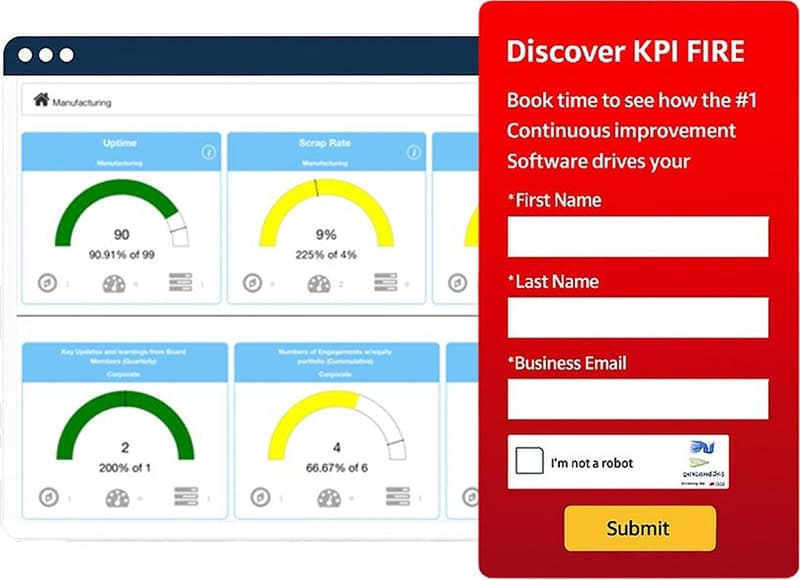
Turn Ideas into Measurable Business Results – Book Your Free Demo Today!
Join world-class companies that have tracked and saved over $1.4 Billion with KPI Fire.
- Track Cost Savings & ROI in Real Time
- Align Strategy with KPI Metrics
- Drive Execution & Engage Teams
Schedule a 30-minute demo to discover how KPI Fire can boost your business.