KPI Fire New Features / Functionality
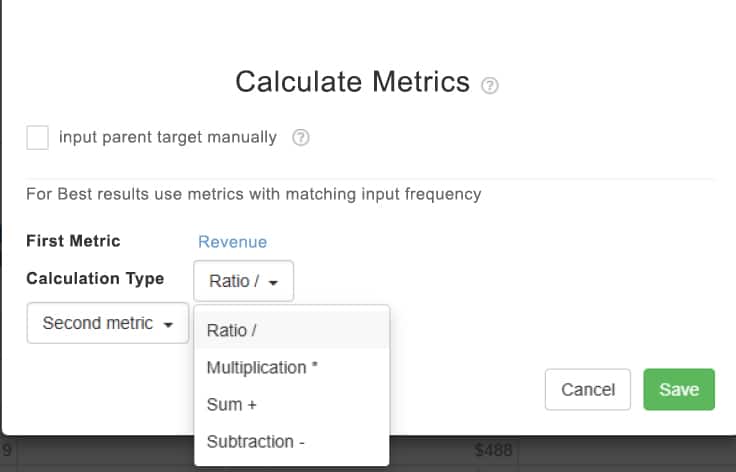
Metric Calculations Now Include Ratio, Multiplication, Subtraction, and Addition
Formerly you could define a Metric like Revenue Per Employee, by using a Ratio calculation. Now you have the ability to define metrics by Multiplying one Metric by another, or by Summing or Subtracting one from another. Example: take Cost per Unit Metric, and multiply by the Total Units Sold, to get a brand-new metric Cost per Unit Sold.
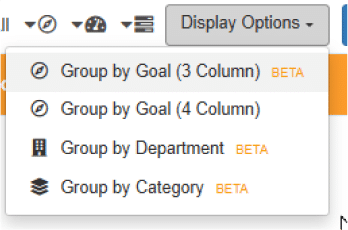
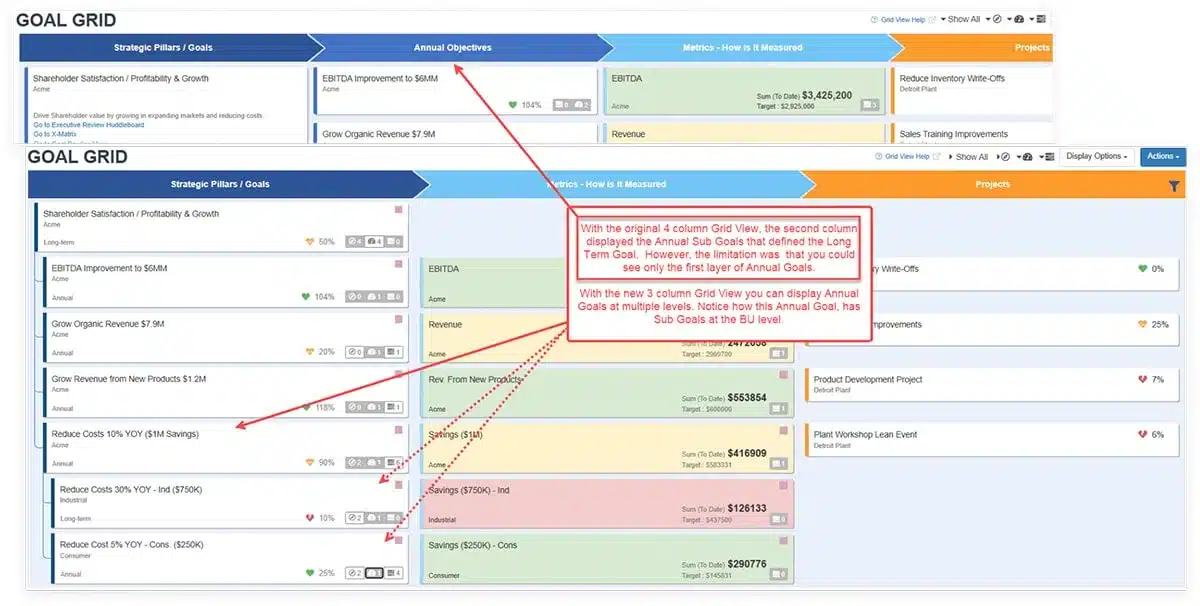
Grid View Options Currently in BETA
Choose how the Grid View displays the new Group by Goal (3 Column), the traditional Group by Goal (4 Column) Group by Department, or Group by Category. On the Grid View use Display Options to change your view.

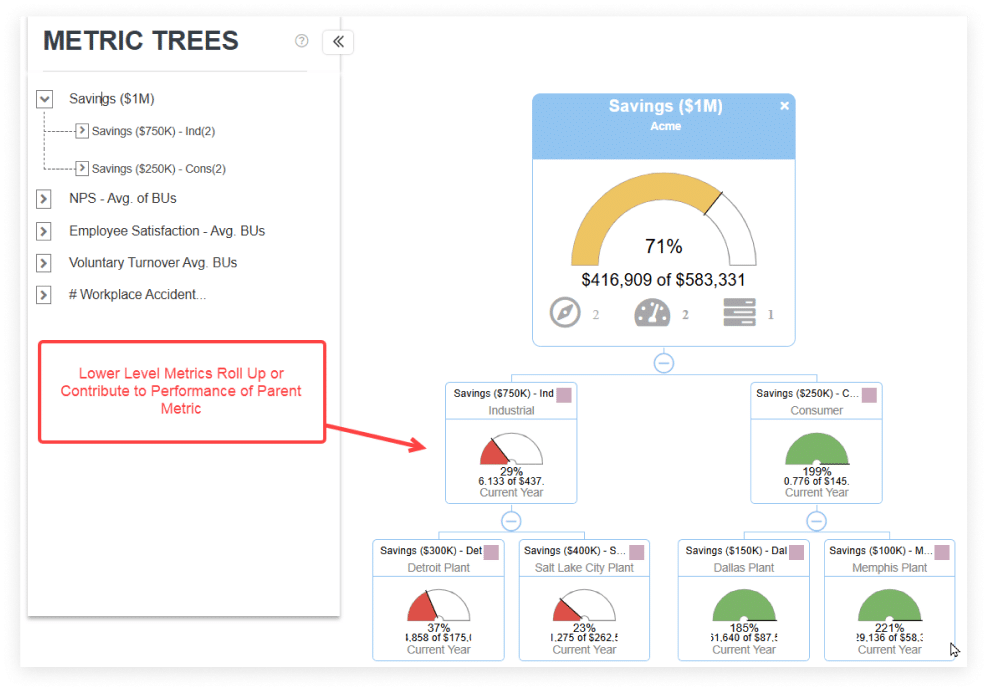
Introducing the Metric Trees View
Accessed through the Metrics item on the Main Menu Bar, this view provides a drill down of all Linked Metrics, or Parent Sub Metrics. Great way to view all the metrics in the tree to identify potential weak spots affecting the performance of the Parent Metric.
New Filter Options on “Clear Filters”
In the past, the Clear Filters option on any View, would simply eliminate all selected filters to show all. Now there is a second option, “Reset Filters” which automatically filters for your User Name, and your Department. Makes it easier to set filters and find what you’re looking for.
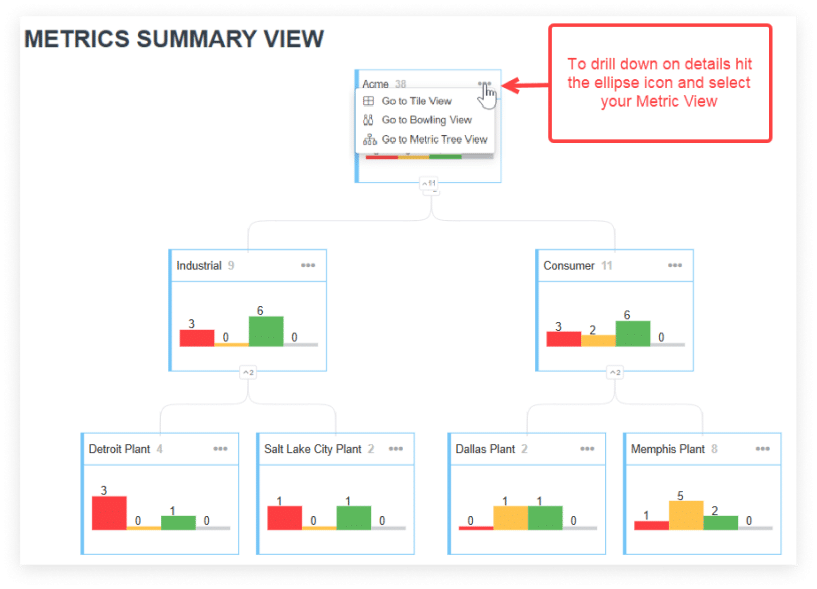
Introducing the Metric Summary View
Accessed through the Metrics item on the Main Menu Bar, this view provides a summary of Metrics by Department with total counts, and counts on how many Metrics are Red, Yellow, Green or Gray (have no current data for this period). Provides the ability to quickly locate Metric data and drill down to details.
Metric Bowling View Display Options
If you have multiple Metrics where some are Monthly, some Weekly, and Some Quarterly… you can now display the Metric Bowling View grouped by Frequency. Makes it much easier to locate and manage the Metrics you’re looking for.
Project Timeline and Portfolio Timeline Report Have New User Interface & Capabilities
From a project select the Timeline view, or from the Projects / Reports menu select Project Portfolio Timeline… they both have improved functionality and look and feel.

As well you can now hover over any Task to view the Owner, Due Date, Status, Priority and any Tags on that Task.

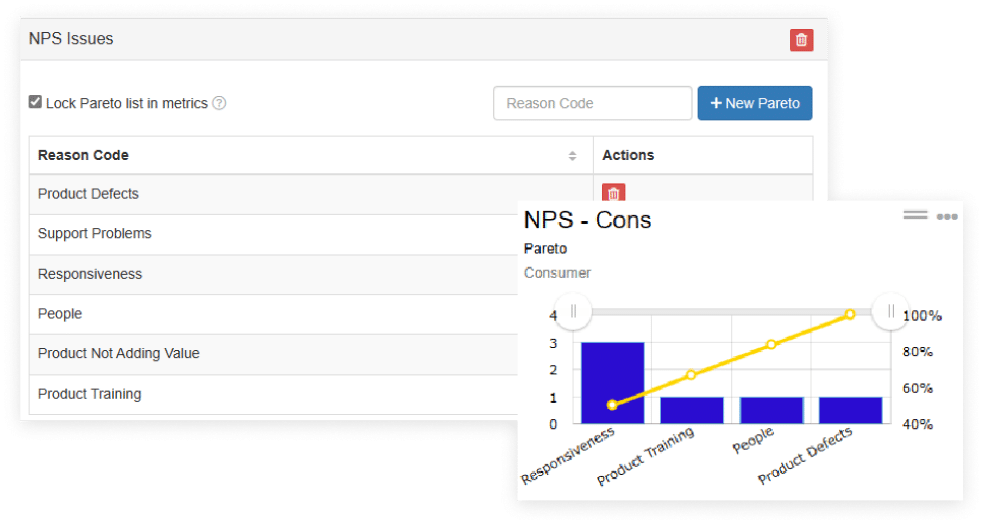
Ability to Lock Pareto List Values
When using the Pareto List Reasons on a Metric, you can now lock the values that can be selected to a set list of reasons. This ensures only those values can be used and increases the accuracy and value of the Pareto chart. In this example when selecting the reason for a low NPS score we have locked the possible values to six options.
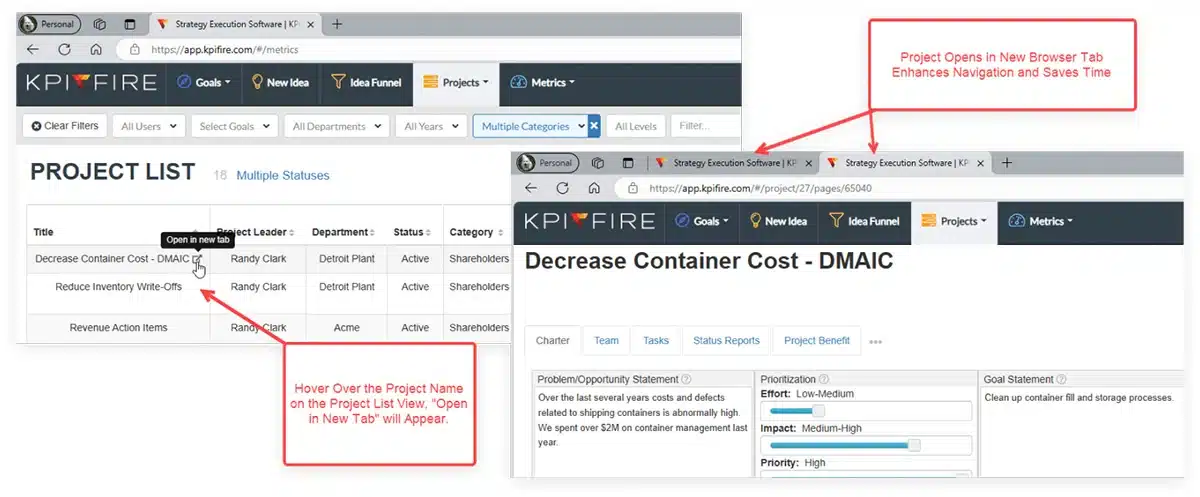
Added “Open in New Tab” Option on the Project List View and the Benefit Exception Report
“Open in a New Tab” facilitates quicker, easier drill downs.
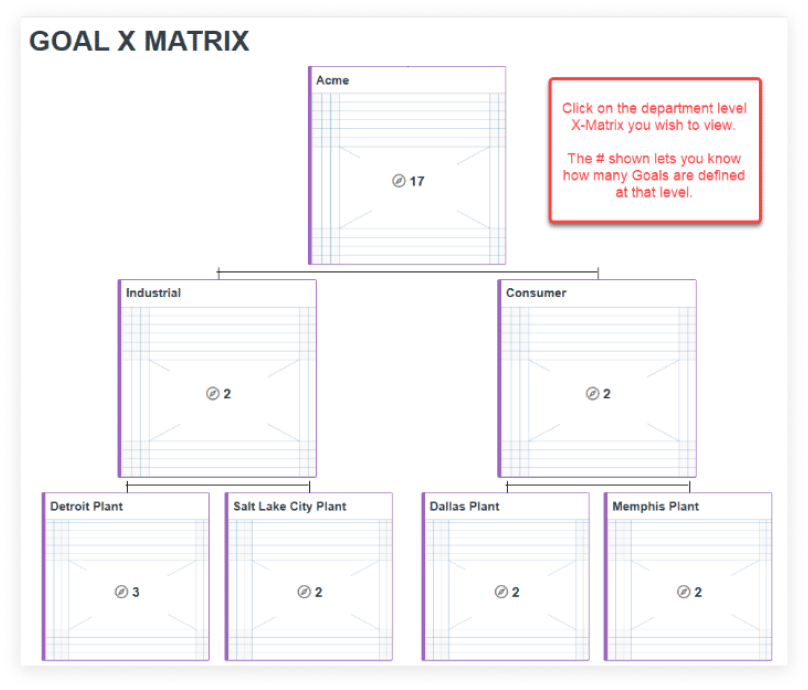
New X-Matrix Tree View
When you open the X-Matrix you now have the ability to select what level you wish to view, instead of always opening at the highest level. Enhances navigation and clarity of data at the appropriate department level.
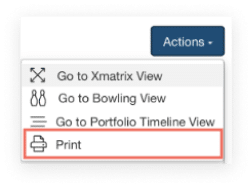
Enhanced Print Capability on the X-Matrix
Use the “Actions” button to Print your X-Matrix.
“My Projects” View Defaults to Display Last Project You Were Working On
When you log in, the project you’ve been working on is displayed, no need to select it from the list.
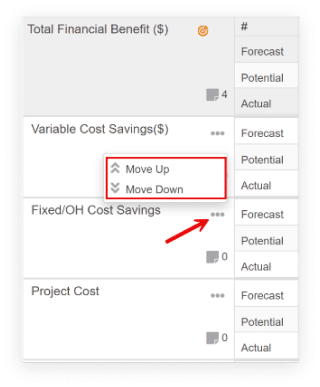
“Project Benefits” Re-Order the Benefit Accounts
Ability on a project to re-order the Benefit Accounts to better match the purpose / intent of the project. In this example, if “Fixed/OH Cost Savings” is the primary driver of the project, move that line to the Top.
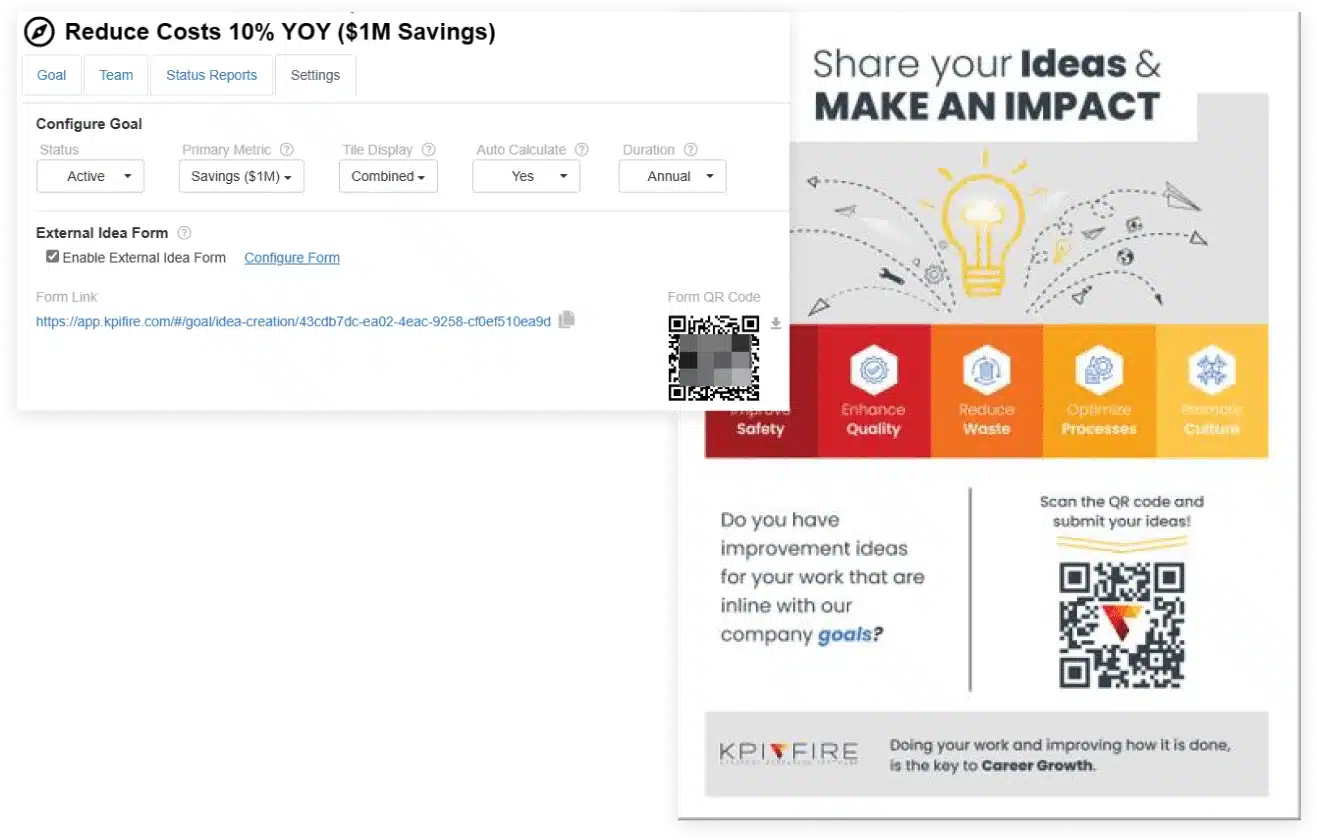
Introducing QR Code Generation for Idea External Forms
Previously you could generate an External Idea Form from any Goal producing a URL that could be included in an email or web page. Now you can generate a QR Code to enhance the idea capture process. Create your own posters with the QR Code, and anyone with a cell phone can submit an idea.
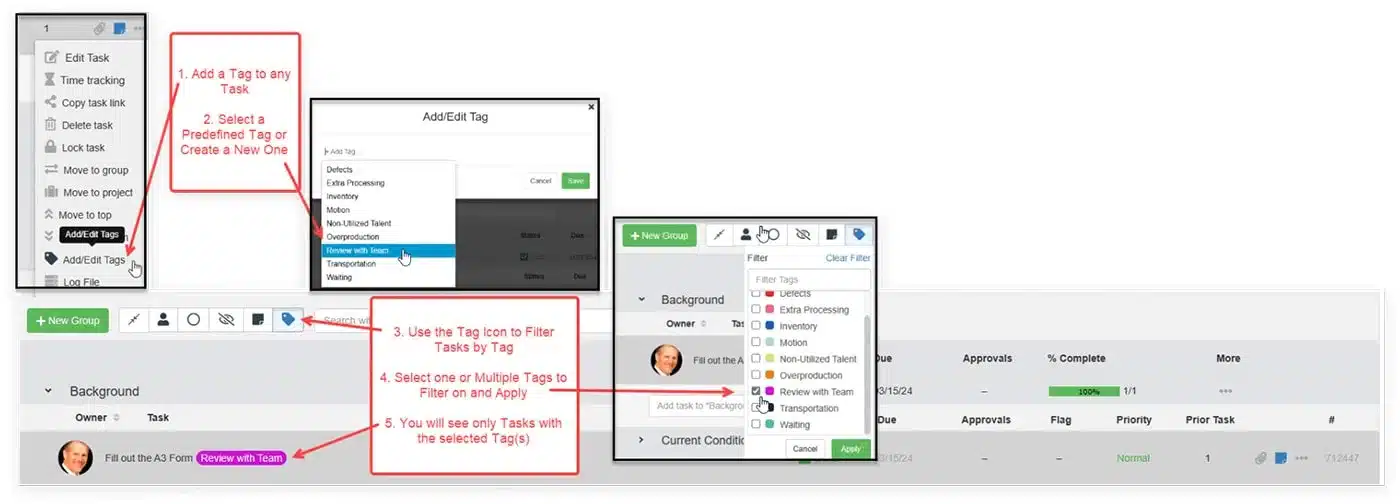
Ability to Tag Tasks in a Project Plan, and Filter the Task List on a Tag, or Multiple Tags
Introducing a new “Tag Filter” feature to easily view and manage project tasks based on specific tags.
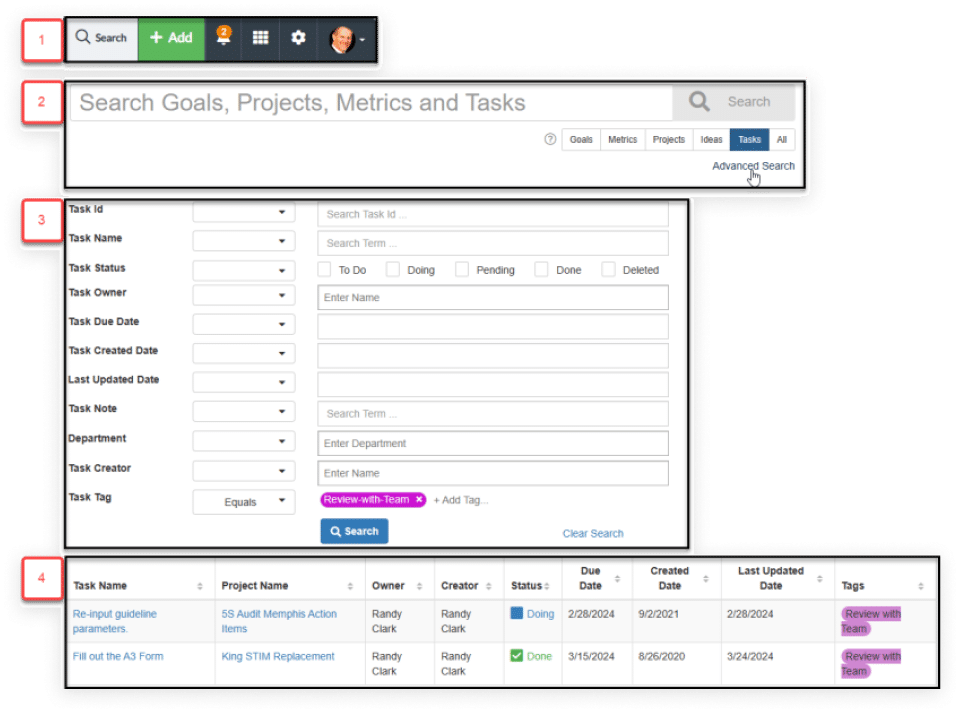
Use Advanced Task Search to Find all Tasks with a Tag Across Projects
From the Main Menu select Search, then Tasks, “Advanced Search”, Set Task Tag to Equals, then select the Tag or Tags, and hit Search.
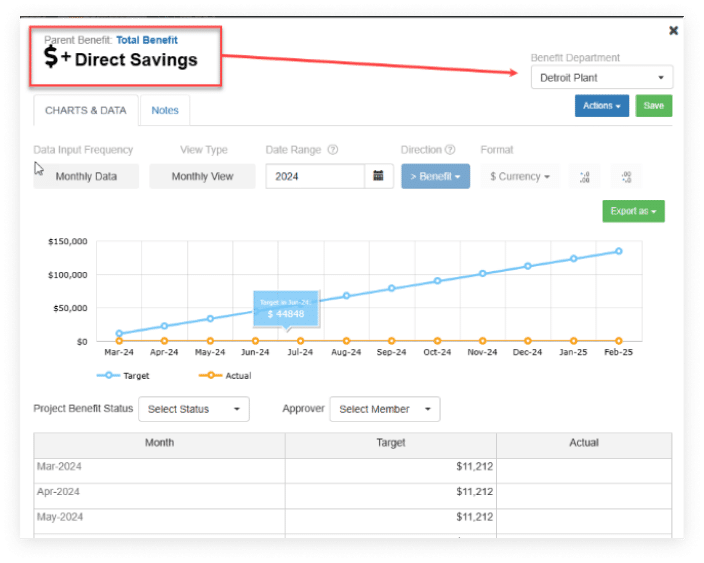
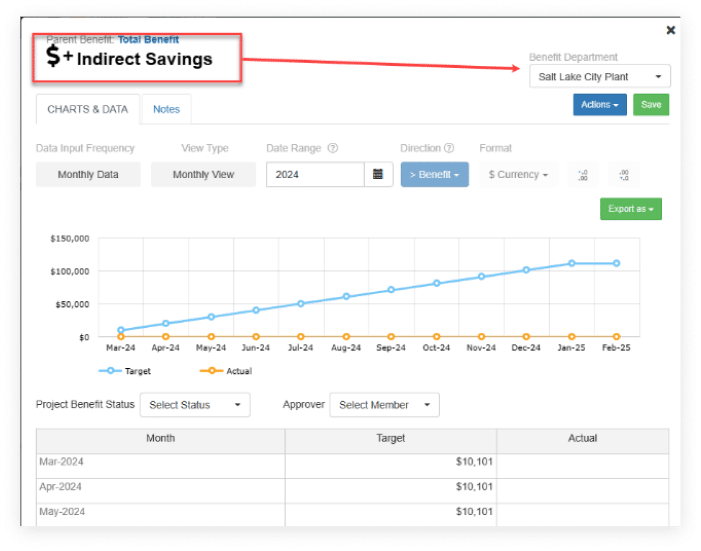
Benefit Account Line Items can now be Assigned to Different Departments
If a project being executed in one department produces a Benefit or a Cost for a different department KPI Fire can now apply that Benefit/Cost to multiple departments. Example here: Project is delivering “Direct Savings” to Detroit, as well as “Indirect Savings” to Salt Lake City. These numbers will roll up to the appropriate Departments in all Benefit Reports. This feature is controlled by Advanced Settings and is not available in current sites unless activated. (Contact support / customer success manager for assistance with this feature.)
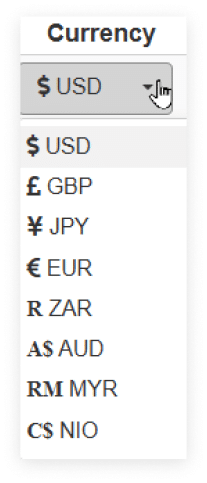
Currencies Now Supported / Currency Conversion
KPI Fire can now display currencies in, US Dollar, Pound, Yen, Euro, Rand (ZAR) Australian Dollar, Malaysian Ringgit, and Nicaraguan Cordoba. Enter project benefits in Euro, or Pond, and display the total in a common currency using latest exchange rate.
Set Default Benefit Currency for a Department
If one of your departments is in Europe, then set the default Currency to Euro. Now any time a project is created in that department the Benefits will be tracked in the local currency.
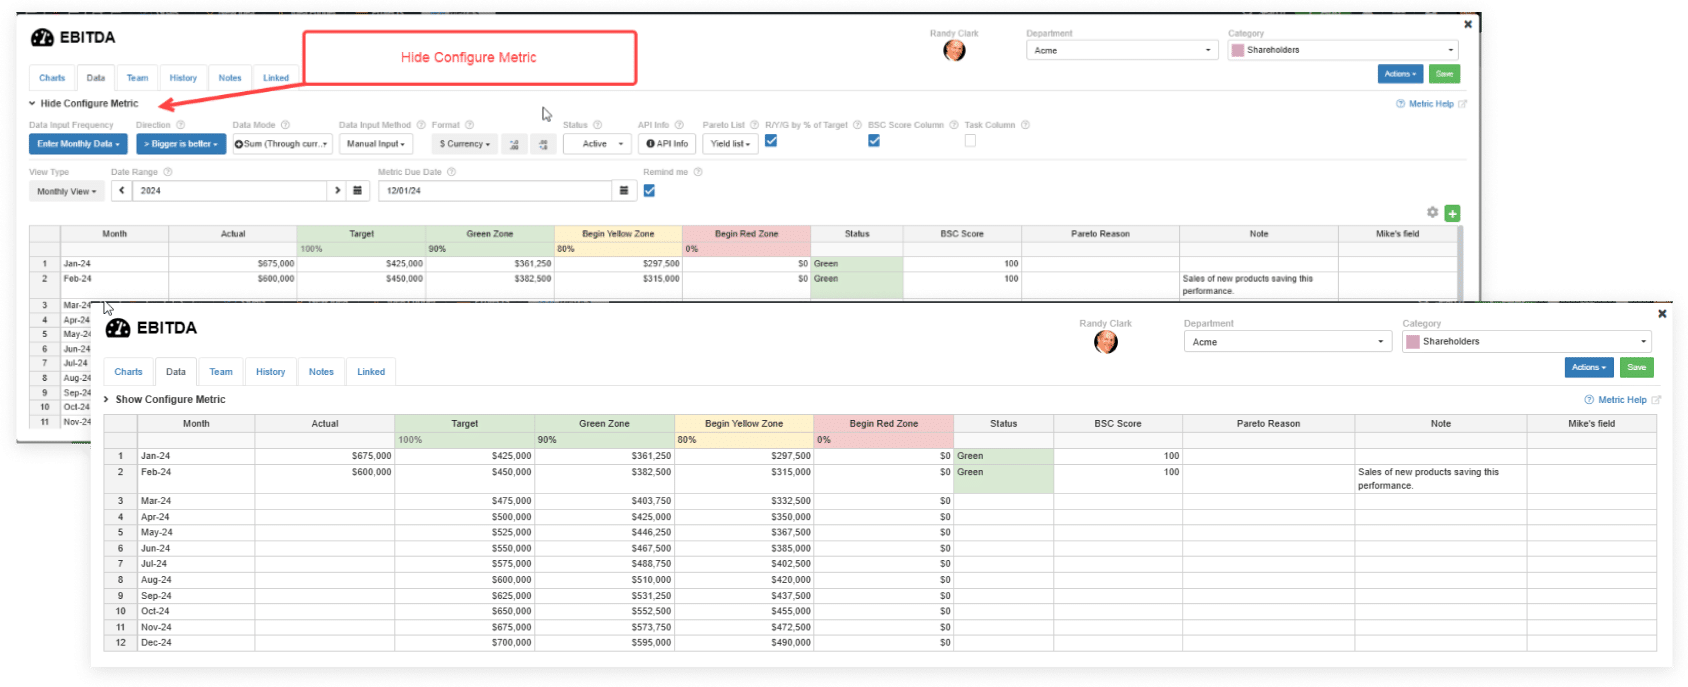
On Metrics Hide or Show Configure Options
Once a Metric is configured, in terms of the frequency, data type, format, etc.. you can they Hide the Configuration options which expands the data fields and makes for a cleaner data input area.
Project List View Now Displays # Days Open
Users can now display the “# Days Open” on the Project List View, as well as sort by this filed and filter for projects that have been open for over a desired number of days.

Actual Project Benefit ROI Now on Project Charter
Where previously only the Target ROI was available, users can now view both the Target Return on Investment (ROI) and the Actual ROI on the Project Charter page.

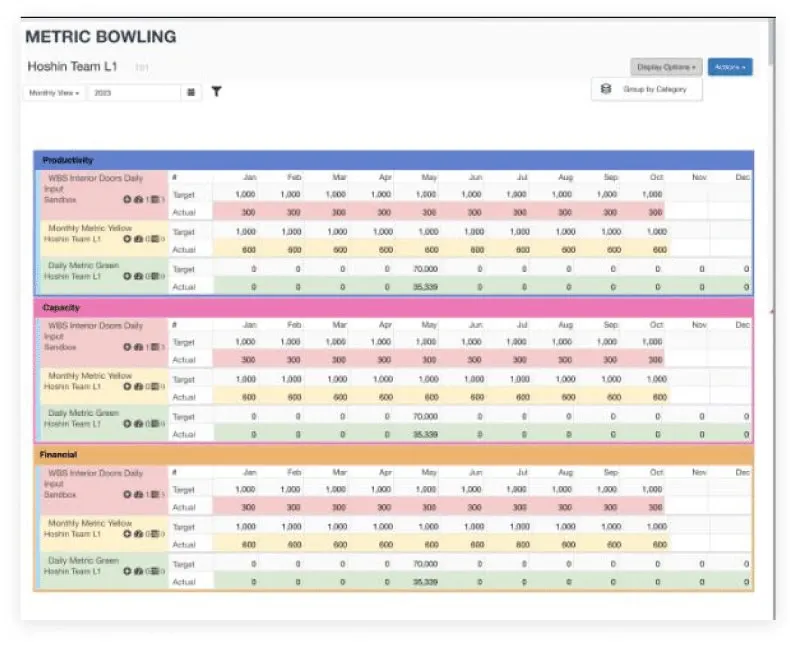
Metric Bowling View by Category
Added option to group by category and use category color as border color for groups.
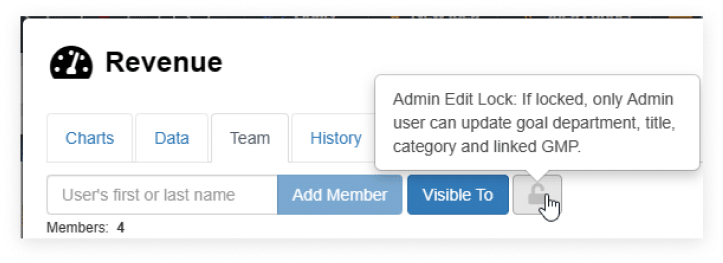
Metric Lock
Metric Lock – Now locks the Metric Target, Begin Green, Begin Yellow, Begin Red, Department and Category fields. This ensures anyone who has edit authority to enter Actuals can not accidentally delete or modify the Targets and other key variables. Use the Lock Icon on the Metric “Team” tab.
New Project Benefits Exception Report
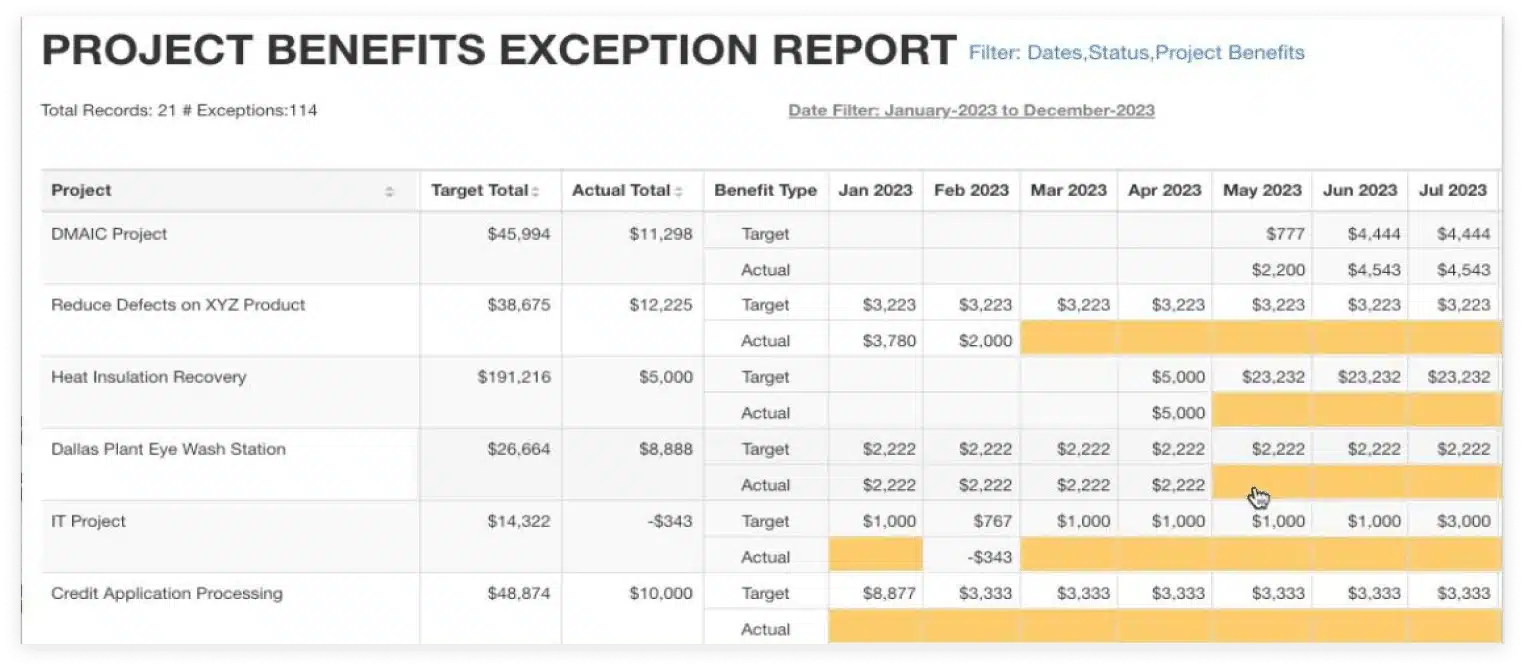
New report to help you quickly identify projects that have a Target Benefit, but no Actual has been entered yet. Months that have a Target Value but no Actual Value appear highlighted in yellow.
Update Workflow: Applied to all Existing Projects
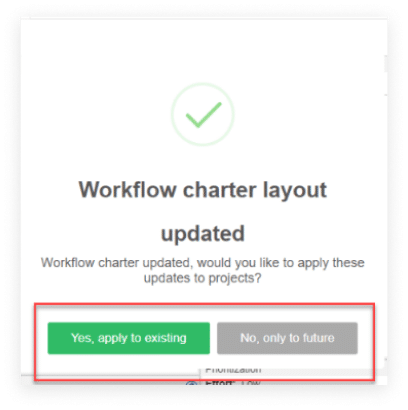
If you make a change to the Charter Layout, add a new Text Tile, a new Custom Field, etc, to an existing Workflow, you can now choose to apply that change to all existing projects currently using that Workflow.
Project Teams
Simplified the project team member edit/access settings/
Separated the Edit/Read access from the License Types. There are now simple options for indicating a team member’s edit rights.
- Owner (can edit all areas)
- Editor (can edit all areas)
- Edit-Own (can edit status of tasks assigned to the user)
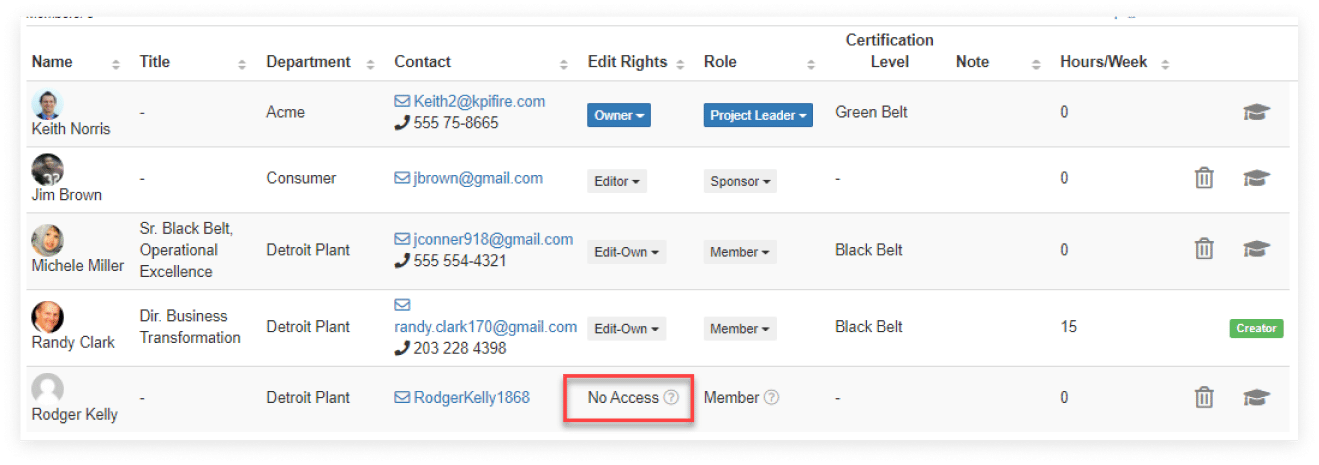
- No-Access (Team member does not have access to KPI fire, but will be listed in Reports)

Added a “No Access User”
Lets say you want to track who is working on a project, but that person does not need to log in. You can now add team resources as a “No Access Member”.
- Better track all of the people involved in your improvement program and projects
- Add no-access team members. No additional cost.
- Users can be upgraded to receive access later if company settings allow.

Metrics: New Custom Date Frequency
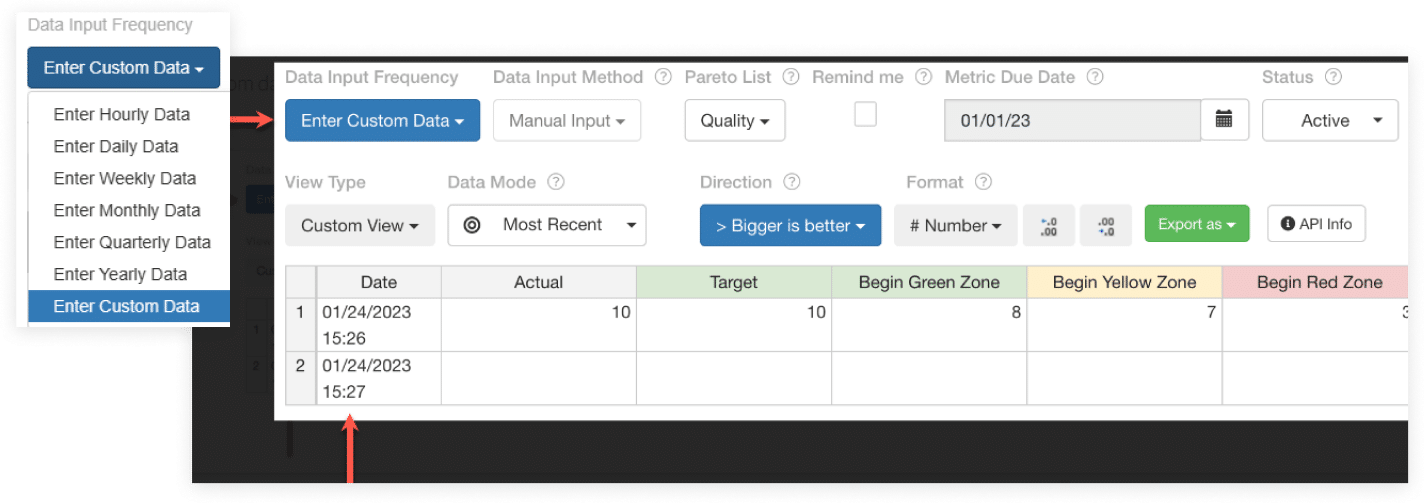
Formerly you could choose the frequency of a Metric from a number of options; from Hourly to Yearly. But what if the data comes at random times, say if you are tracking the cycle time of a client implementation. This could happen every day, or once a month.
Idea Submission Form Configuration
You can now decide whether you want the Idea submitter to rate the Effort and Impact of the idea they submit. This allows a possibly more qualified individual or team to do the rating and prioritization as the idea is compared with others in the funnel.

“Close the Books” Financial Lock Dates
Ensures the numbers you are reporting on project benefits are consistent and accurate and are not subject to accidental changes. KPI Fire Administrator selects the date ranges to lock.

Metric Trend Line
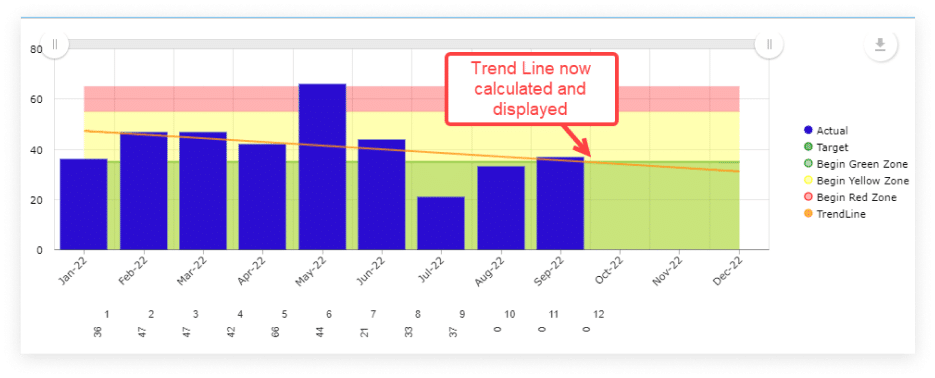
Metrics now include a Trend line. Allows you to project future performance based on current trend.
Balanced Scorecard
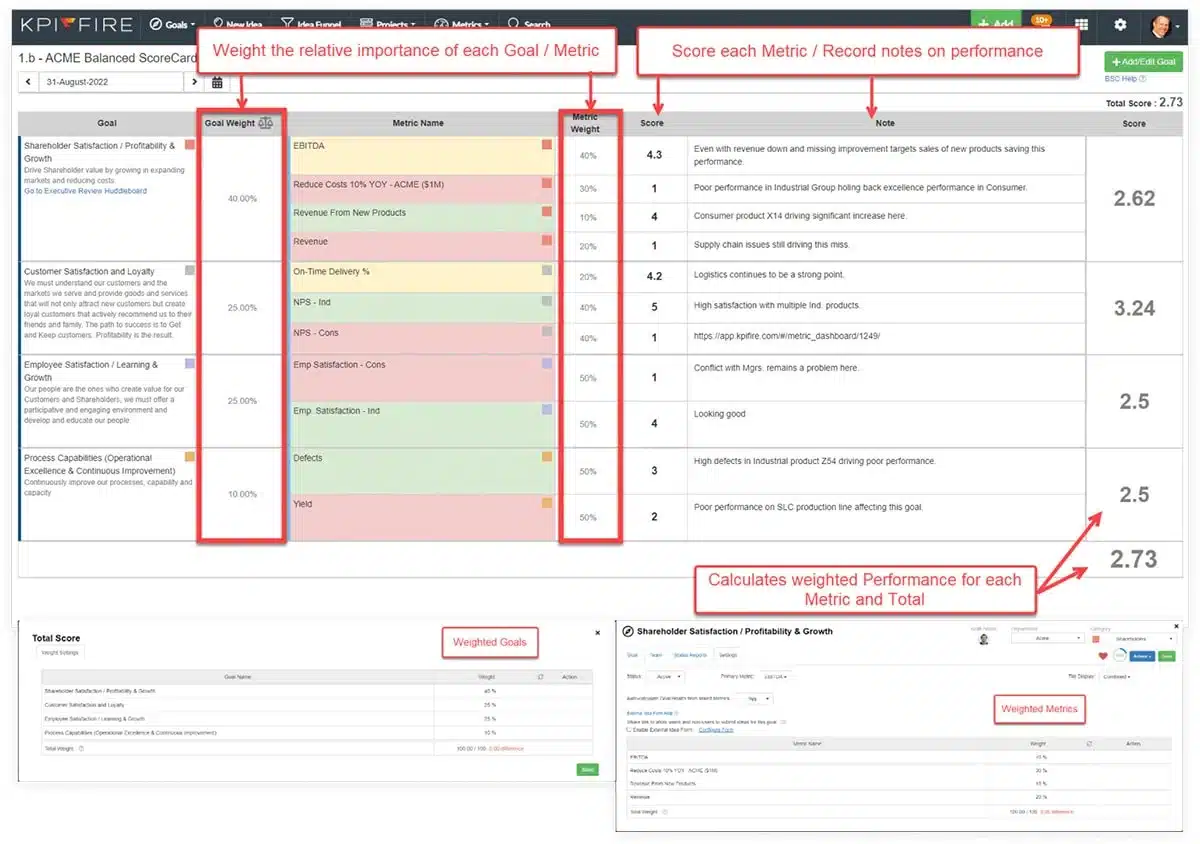
The new Balanced Scorecard Huddleboard allows you to weight goals and metrics to calculate a weighted performance score. Example below: the total performance score is based 40% on Shareholder Performance, 25% on Customer Satisfaction, etc… Within the Shareholder goal, EBITDA metric weighted 40% while Cost Reduction is worth only 30%, etc.
Added Filters to the Idea Funnel Page
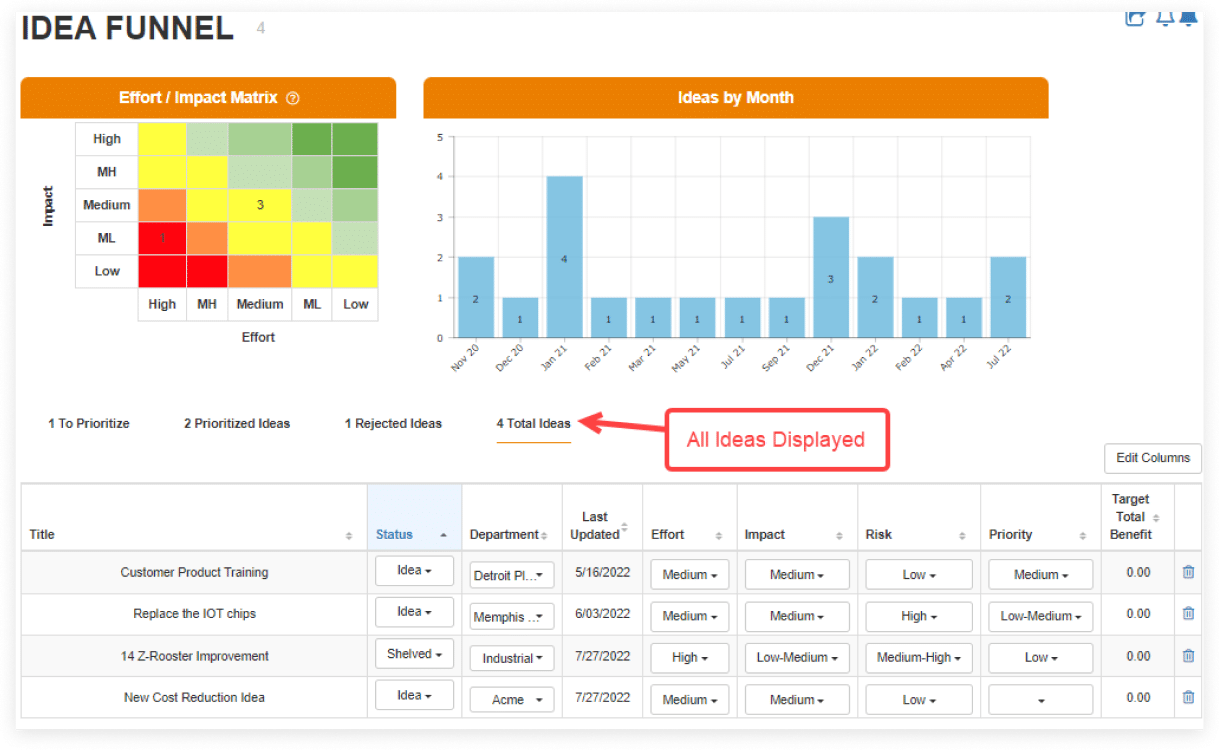
Now you can filter your list of Ideas by
- All Ideas
- Those that need to be Prioritized
- Prioritized
- Rejected
Makes it easier to filter and view those ideas requiring action.


Manage Financial Benefit Approvals
This feature is for you if:
Your program requires approval of target savings (target benefits or costs) before a project is approved beyond a particular stage gate. Or, Your program requires an approval of claimed actual benefits which will help you avoid PPDs (PowerPoint Dollars). PPDs look great in presentations but are often exaggerated, or lack accurate assumptions.
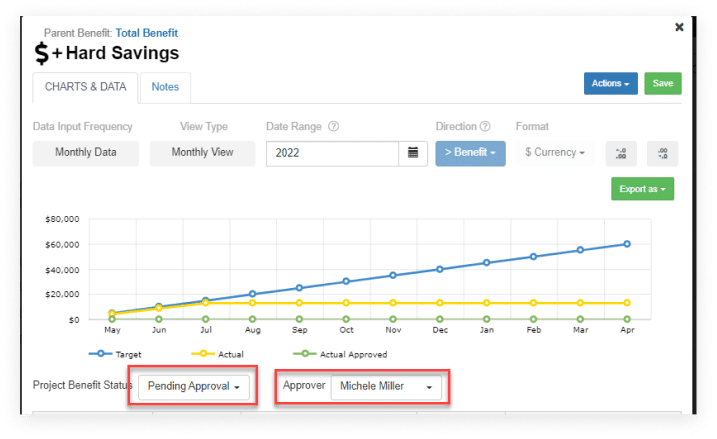
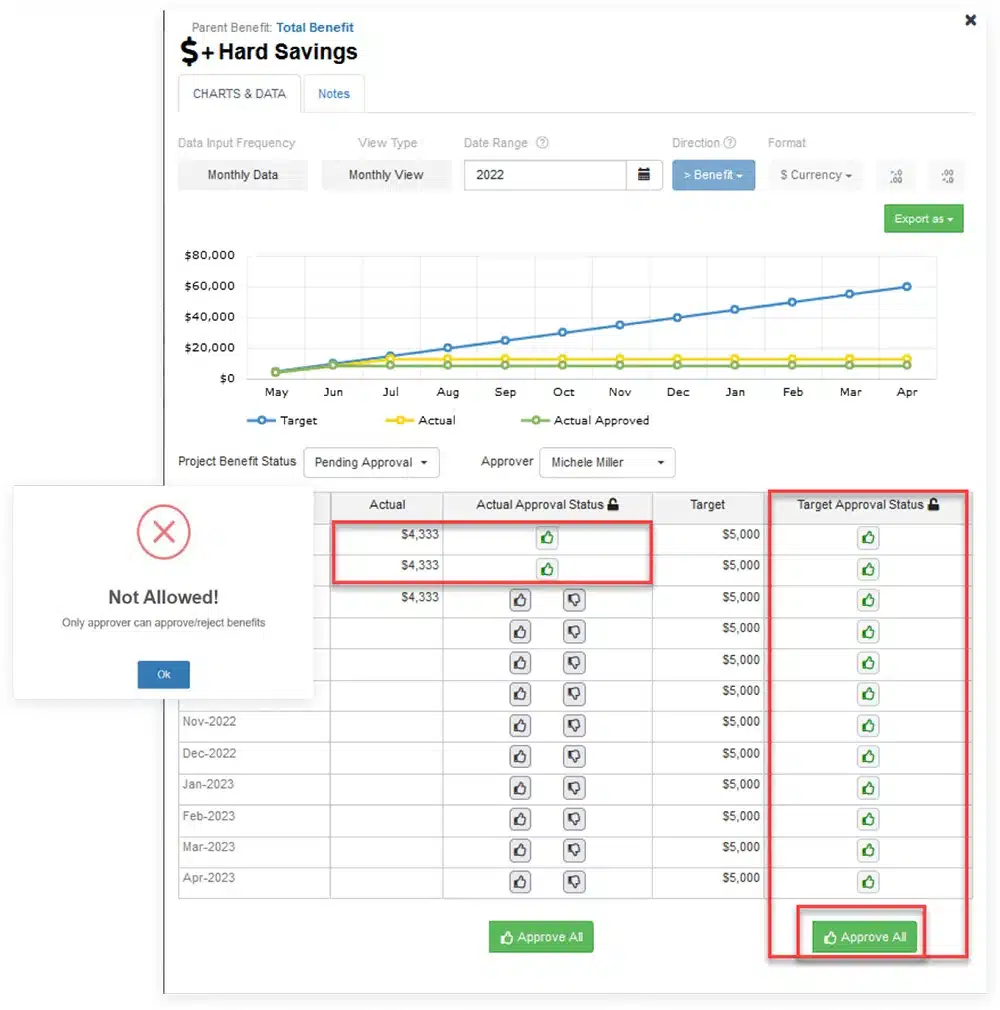
First step assign the Approver, and set the the project to Pending Approval. This will generate an email to the approver.
In this example you can see that the approver used the “Approve All” button to approve all the Target benefits, but has only approved the first two months of Actuals. The approver can use the Notes function to explain why the third month was not approved.
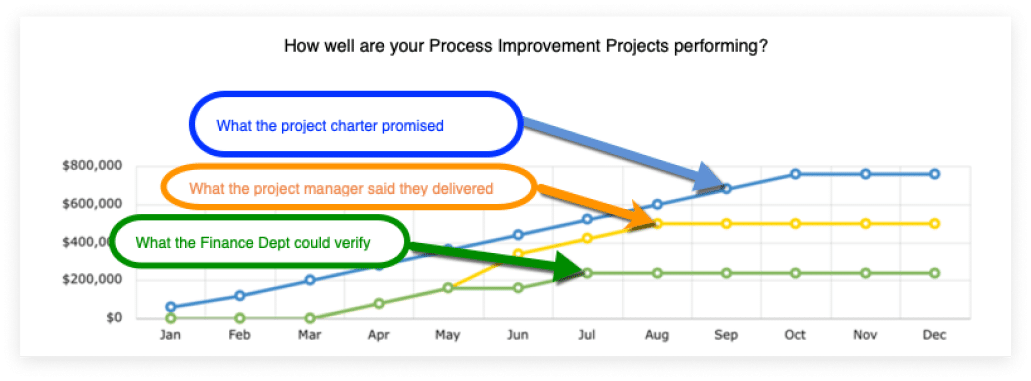
If a project owner attempts to approve their own project benefits they will receive a stern warning that this is not allowed. This approval process ensures you have the information to understand what was promised, what the owner of the project said they delivered, and what the approver could verify.
Adjust Start Month for Project Benefits
KPI Fire allows you to track project benefits over the time frame that you will accrue those benefits. Most organizations will claim a full 12 months of benefits for a project’s value. Set a start month for project benefits to make it easier to see a full 12 months’ worth of project benefits on a single screen. Click on any line item, and a pop up appears where you can enter data and drag and drop ammounts that repeat, similar to excel data entry functionality.

Metrics> Direction > Control Chart
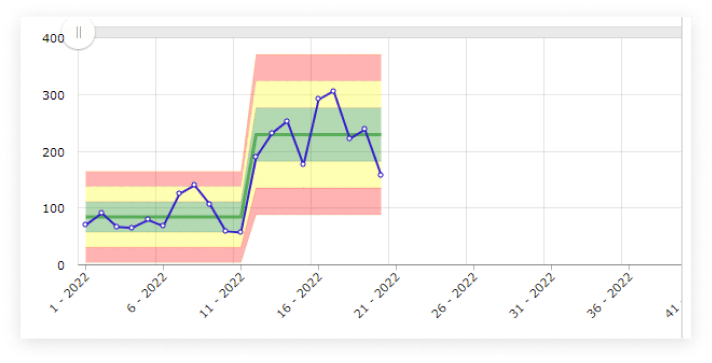
KPI Fire has added Control Charts or Statistical Process Control Chart (SPC) which allow monitoring how a process is performing over time and to help determine if there is any special cause variation (read more details How to Use Control Charts )

Here’s a typical Control Chart. The solid green line is the Mean, 1 standard deviation (StDev) from the mean is the green zone, 2 StDev the Yellow zone, while the boundaries of the red zone represent the Upper and Lower Control Limits. We see a pretty normal variation with one concerning data point that is outside the UCL, and thus points to some type of special cause that will be worth investigating.

In this example you can see that as performance improved we set a new range.
No Access Users
You can now add “No Access” users to KPI Fire. This allows you to list people on projects and provides better reporting on who is involved and participating on projects, without counting as a paid user.
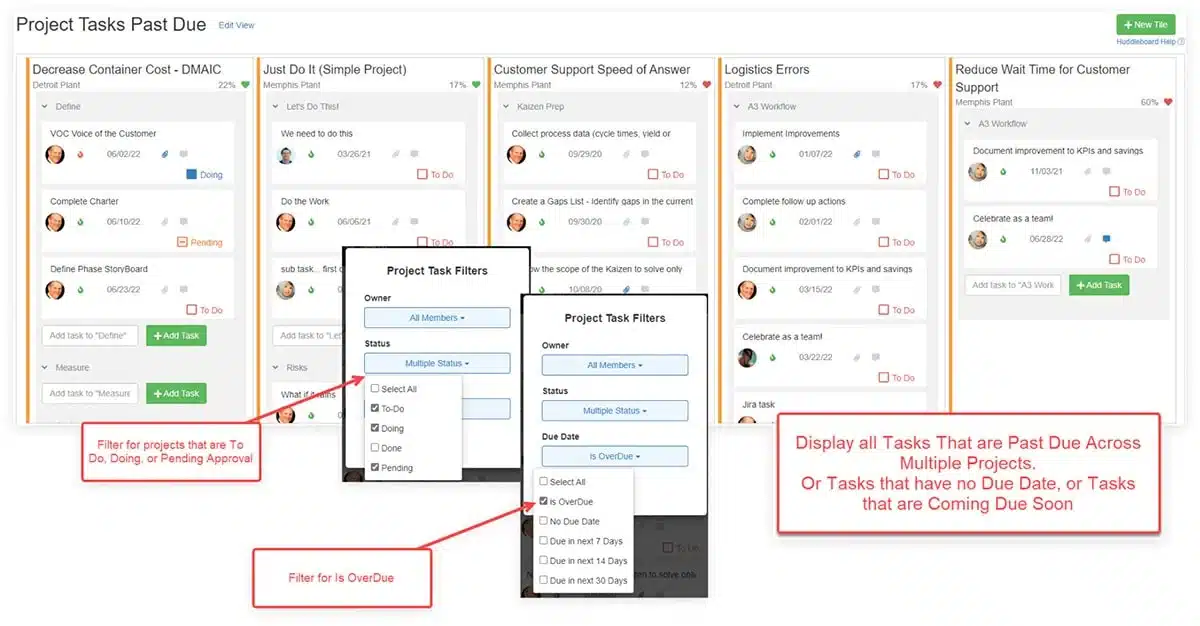
Huddleboard Project Task Filters
Answering the question what tasks are overdue on my projects? You can now display project tasks by project on a Huddleboard, and filter by Owner, Status, and Due Date.
