
In today’s fast-paced business environment, data is the lifeblood of decision-making. But raw data alone can be overwhelming and difficult to interpret. This is where KPI (executive) dashboards come in. What is a KPI dashboard? Well, imagine having a real-time, visual command center that displays the most critical information about your business performance all in one place.
That’s the power of a KPI dashboard. This article is designed to provide a comprehensive understanding of KPI dashboards, their importance, and how to effectively utilize them. Whether you’re a business owner, manager, or analyst, this guide will equip you with the knowledge to leverage KPI dashboards for better decision-making and improved business outcomes.
What Is a Key Performance Indicator (KPI) Dashboard?
KPI dashboard is a visual tool that consolidates and displays key performance indicators (KPIs) in a single, centralized interface. This allows users to quickly and easily monitor business performance across a variety of relevant metrics. By providing real-time data visualization, KPI reporting with KPI dashboards help businesses track progress towards their goals, identify trends, and make informed, data-driven decisions.
These dashboards transform complex data sets into easily understandable visual formats, enabling stakeholders to grasp the current business performance at a glance. In essence, a KPI dashboard acts as a dynamic and interactive display, offering a snapshot of an organization’s health and performance.
Benefits of KPI Dashboards
Effective KPI dashboards offer numerous benefits to businesses, providing valuable insights that drive strategic decision-making and improve overall performance. By presenting complex data in a user-friendly, visual format, these dashboards empower stakeholders at all levels to quickly understand the organization’s health and progress towards its objectives.
Visualize Key Performance Indicators
KPI dashboards provide businesses with real-time data, enabling them to continuously track their performance and make timely adjustments as needed. This real-time visibility empowers decision-makers to respond swiftly to issues, ensuring the business stays on track and aligned with its strategic goals.
Quickly Identify Trends, Issues, and Opportunities
By providing immediate visibility into key success metrics, KPI dashboards help businesses to quickly spot trends, identify operational issues, and seize opportunities. Dashboards that incorporate visualization tools, such as graphs and charts, enable users to swiftly identify patterns and outliers, supporting more informed and effective decision-making.
Improve Operational Efficiency
Businesses can leverage the insights provided by KPI dashboards to optimize their operations, identifying areas of inefficiency and recommending actions for improvement. These insights enable businesses to focus on areas where they can streamline processes, such as reducing downtime or improving inventory turnover, ultimately leading to greater operational efficiency.
Enhance Cross-Departmental Collaboration
Shared KPI dashboards promote transparency and alignment between teams, ensuring that all departments are on the same page and working towards common objectives. Access to the same real-time data fosters cross-functional collaboration, enabling teams to work in sync and improve overall business performance. KPI dashboards essentially empower businesses to communicate better with less words.
Types of KPIs to Track
There are various types of KPIs that businesses can track, depending on their specific objectives, industry, and operational needs. These KPIs can be broadly categorized to provide a comprehensive view of performance across different dimensions of the business.
Financial KPIs
Financial KPIs are metrics that track a business’s financial health and profitability. These are essential for decision-makers to measure revenue, profit margins, and return on investment. Financial KPIs help businesses forecast growth, assess profitability, and plan for future investments.
Examples:
- Revenue Growth
- Gross Profit Margin
- Net Profit Margin
- Return on Investment (ROI)
- Cash Flow
Operational KPIs
Operational KPIs are metrics that focus on the efficiency of business operations. These KPIs measure factors like production efficiency, inventory turnover, and supply chain performance. Operational KPIs are vital for improving internal processes and ensuring that businesses run efficiently and cost-effectively.
Examples:
- Production Lead Time
- Inventory Turnover Ratio
- Order Fulfillment Rate
- Defect Rate
- On-Time Delivery Rate
Customer KPIs
Customer KPIs are metrics that measure customer satisfaction, retention, and loyalty. These are critical for businesses to ensure long-term customer relationships and repeat business.
Actionable Tip: Tracking customer KPIs helps businesses understand customer sentiment, and this data can guide improvements in the customer experience.
Examples:
- Customer Satisfaction Score (CSAT)
- Net Promoter Score (NPS)
- Customer Retention Rate
- Customer Churn Rate
- Customer Lifetime Value (CLTV)
Features of an Effective KPI Dashboard
An effective KPI dashboard template includes several key components that work together to provide clear insights, enable real-time monitoring, and can be customized to meet the unique needs of the business.
Clear Visualization
Clear visualization is critical for easy data interpretation. Dashboards should present KPIs in a simple and digestible format, such as charts, graphs, or gauge meters, to ensure that the information is quickly accessible and understandable. Visual elements like color coding or trend lines help quickly identify patterns and track progress over time.
Real-Time Data
Real-time data is one of the most powerful features of a KPI dashboard. By using KPIs metrics for tracking progress, businesses are empowered to monitor progress continuously, react quickly to changes, and make data-driven decisions without waiting for end-of-period reports. With real-time updates, businesses can stay proactive in addressing issues or optimizing operations.
Customizability
Customizability is key for a KPI dashboard to serve different business needs. Businesses should be able to tailor the dashboard to track specific KPIs and filter data based on departments, goals, or timeframes. KPI Fire allows businesses to customize dashboards so teams can track the metrics that are most relevant to their specific roles or departments.
Actionable Insights
Actionable insights enable businesses to take immediate action based on the data displayed. Dashboards should not only show numbers but also provide insights and recommendations on how to improve performance. KPI Fire provides recommendations and alerts, ensuring businesses take corrective actions in real time.
Interactivity
Interactivity in a KPI dashboard allows users to explore data in depth. Features like drill-down capabilities enable users to click on specific data points or categories to analyze the metrics in more detail and make more informed decisions. Interactive elements, such as clickable charts or filters, make it easier to identify trends, spot anomalies, and take quick corrective actions based on the data.
Creating a KPI Dashboard
Creating an effective KPI dashboard is essential for businesses looking to track their key metrics and drive performance. Here’s a step-by-step guide to help you get started:
Define Key Metrics for Tracking
The first step in creating a KPI dashboard is to define the key metrics that align with your business objectives. These metrics will help measure performance and drive actionable insights. Focus on metrics that directly impact your BHAGs, strategic goals and overall performance. For example, if your goal is to improve customer satisfaction, relevant metrics could include your CSAT score and Net Promoter Score (NPS).
Set Targets for Each KPI
Setting targets for each KPI is crucial. Without targets, KPIs lack direction, making it difficult to measure success. Setting realistic, time-bound targets helps ensure focus and accountability. Actionable Tip: Use the SMART criteria (Specific, Measurable, Achievable, Relevant, Time-bound) when setting targets for your KPIs.
Select Data Sources
Identify the data sources that will feed into your KPI dashboard. These sources may include CRM systems, marketing platforms, financial software, and production databases. Integrate all relevant data sources into your dashboard software for a holistic view of performance across different departments.
Choose the Right Visualization Tools
Visualization tools like graphs, charts, gauges, and tables are key for displaying KPIs in a meaningful way. Choose visual tools that make data easy to interpret and actionable, helping users quickly spot trends, issues, and areas for improvement.
Integrate Real-Time Tracking
Integrating real-time data into your KPI dashboard is essential for businesses to stay responsive and adapt quickly. Use a KPI dashboard software that allows for real-time data syncing from your various systems, providing up-to-date insights that enable you to make decisions on the fly.
Evaluate Progress and Adjust as Needed
Regularly evaluate progress against your KPIs to ensure that you are on track to meet your strategic goals. Use your KPI dashboard to monitor performance trends and assess whether adjustments are needed. If certain KPIs fall short of their targets, take corrective actions.
Examples of KPI Dashboards
KPI dashboards vary based on industry, business objectives, and the role of the user. Here are a few examples:
Executive KPI Dashboard
An Executive KPI Dashboard is designed for C-level executives like the CEO, CFO, or COO. It provides a high-level view of the business’s overall performance and health. This dashboard typically tracks key metrics such as revenue, profit margins, and market share. It enables real-time decision-making by offering a quick overview of financial health and strategic performance.
Example: A CEO might use this dashboard to monitor the company’s financial performance, identify growth opportunities, and make strategic decisions about resource allocation and new initiatives.
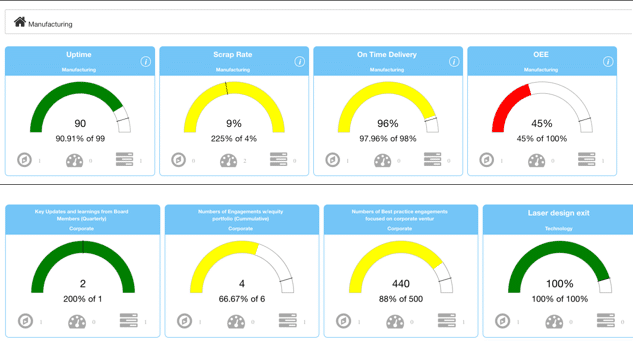
Operational KPI Dashboard
An Operational KPI Dashboard tracks daily performance and process efficiency across operations, production, or customer service. This type of dashboard focuses on metrics related to daily tasks, such as production efficiency, inventory turnover, and on-time delivery. It helps managers ensure that daily operations stay on track.
Example: A production manager could use this dashboard to monitor production output, identify bottlenecks, and ensure that production targets are met efficiently.
Tactical KPI Dashboard
Tactical KPI Dashboards are used by mid-level managers to focus on short-term actions that contribute to strategic objectives. This dashboard tracks KPIs tied to specific projects, departmental goals, or initiatives. It enables managers to monitor progress and ensure that short-term efforts align with long-term goals.
Example: A marketing manager might use a tactical dashboard to track the progress of a specific campaign, monitoring metrics like click-through rates, conversion rates, and cost per acquisition to optimize campaign performance.
Analytical KPI Dashboard
An Analytical KPI Dashboard is used by data analysts or business intelligence teams to perform in-depth analysis of historical data and trends. This type of dashboard is designed to provide insights into long-term performance, helping teams make data-driven decisions and identify opportunities or risks.
Example: A data analyst could use this dashboard to analyze sales trends over several years, identify seasonal patterns, and forecast future sales performance to inform strategic planning.
KPI Dashboard Best Practices
Adopting best practices when designing KPI dashboards is crucial for ensuring their effectiveness. Here are some key recommendations:
Make Dashboards Visually Clear and Engaging
Dashboards should be designed to be easy to understand and engaging for the user. Use visual elements like charts, graphs, and color coding to highlight important KPIs and make data easily accessible.
Limit the Number of KPIs to Focus on What Matters Most
Narrow down the number of KPIs displayed to focus on the most critical metrics. Keep the dashboard concise, with no more than 5-7 KPIs, to avoid data overload and ensure clarity.
Ensure Real-Time Data Synchronization
Having real-time data in your dashboard is essential. Real-time updates allow businesses to make immediate decisions and stay proactive when tackling challenges or making adjustments.
Customize Dashboards for Specific Roles and Departments
Tailor your dashboard to each team or department’s specific KPIs. Customized dashboards provide more relevant insights and help teams focus on what’s directly aligned with their goals.
How KPI Fire Integrates Everything into One KPI Dashboard Software
Businesses can use KPI dashboard software like KPI Fire to centralize data from various departments and track KPIs across multiple business functions, ensuring alignment and operational efficiency.
- Unified Platform for Tracking Performance Metrics: KPI Fire provides a unified platform where businesses can track all their key performance metrics in one place, giving them a comprehensive view of performance across various departments.
- Real-Time Insights for Data-Driven Decision-Making: KPI Fire’s real-time data allows businesses to make immediate decisions based on up-to-date performance metrics, ensuring responsiveness to changes and issues.
- Customizable Dashboards Tailored to Business Needs: KPI Fire offers customizable dashboards that allow businesses to track specific KPIs relevant to their goals and departmental needs, ensuring personalized insights for each team.
- Seamless Integration of Data Sources: KPI Fire integrates data from multiple sources, such as CRM systems, marketing tools, and financial platforms, into a single dashboard, providing a holistic view of business performance.
- Actionable Insights and Recommendations: KPI Fire provides actionable insights and recommendations based on tracked KPIs, helping businesses identify areas for improvement and make data-driven decisions to optimize performance.
Take Control of Your Performance Tracking with KPI Fire
KPI dashboards help businesses visualize performance, track key metrics, and make data-driven decisions in real time. KPI Fire simplifies KPI tracking and dashboard creation, enabling businesses to align strategic goals with operational performance for improved decision-making.
Request your demo today to discover how KPI Fire compares to other business management software platforms – and take ultimate control of organizational performance tracking.


