You made a change.
The metric improved.
Time to celebrate?
Not so fast.
One of the easiest mistakes in continuous improvement is assuming that a change in performance automatically means an improvement initiative worked.
A metric can move up or down simply because of normal variation in the process.
That means the improvement you’re celebrating might not be an improvement at all.
It might just be random noise.
The Problem With Looking at Averages
Imagine you’ve been working to reduce customer response time.
Before the improvement project, your average response time was around 24 hours.
After implementing a new process, you see:
- Week 1: 23 hours
- Week 2: 21 hours
- Week 3: 19 hours
- Week 4: 20 hours
It looks promising.
The average has dropped. The team feels like the new process is working.
But what happens next?
- Week 5: 24 hours
- Week 6: 22 hours
- Week 7: 25 hours
Suddenly, the improvement doesn’t look so impressive.
So what happened?
Possibly nothing.
The process may simply be fluctuating within its normal range.
This is why two data points are not a trend. A better result today doesn’t necessarily mean you’ve fixed the process—and a worse result tomorrow doesn’t necessarily mean you’ve broken it.
For a broader look at how organizations can use metrics to measure and track improvement, see KPI Fire’s guide to continuous improvement metrics.
Is the Process Actually Changing?
This is the question continuous improvement teams should be asking.
Instead of reacting to every movement in a KPI, you need to understand how much variation is normal for the process.
That’s where a statistical control chart can help.
A control chart plots performance over time and establishes expected ranges around the process mean. This makes it easier to distinguish routine variation from signals that may indicate something unusual is happening.
Control Charts Put Your KPI in Context
KPI Fire’s Control Chart functionality automatically calculates the process mean and statistical zones from the actual metric data. The green, yellow, and red zones represent progressively greater distances from the mean.
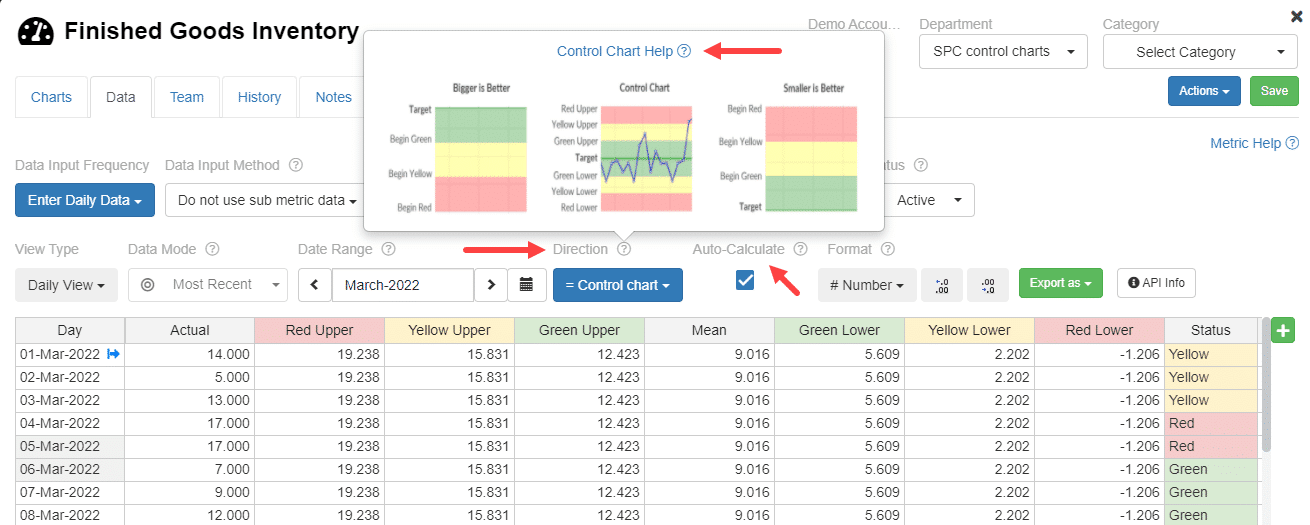
Example of a Control Chart in KPI Fire. The chart displays the process mean along with the 1-, 2-, and 3-standard-deviation zones.
This gives teams something a basic KPI dashboard can’t: context.
Instead of simply asking whether this month’s number is higher or lower than last month’s, you can see whether the movement falls within the process’s expected variation.
This is also why effective KPI tracking goes beyond simply recording whether a number went up or down. The goal is to turn performance data into information teams can use to make better decisions.
Normal Variation vs. Special Cause Variation
Every process has variation.
Some of that variation is expected.
For example, customer response times might naturally change from day to day because of differences in workload, staffing, demand, or other routine factors.
This is common-cause variation—variation that’s built into the process itself.
Then there’s special-cause variation.
This occurs when something outside the normal process creates an unusual result.
The distinction matters because the response should be different.
Normal variation: Don’t overreact. A fluctuation within the expected range doesn’t automatically require corrective action.
Special-cause variation: Investigate what changed and determine whether there’s a specific cause worth addressing.
Understanding variation is fundamental to continuous improvement because improvement teams need to distinguish between routine process behavior and meaningful signals that call for action.
What Does Special Cause Variation Look Like?
Here’s where a Control Chart becomes particularly useful.
The example below shows mostly normal process variation with one data point outside the upper control limit. That point may indicate a special cause worth investigating.
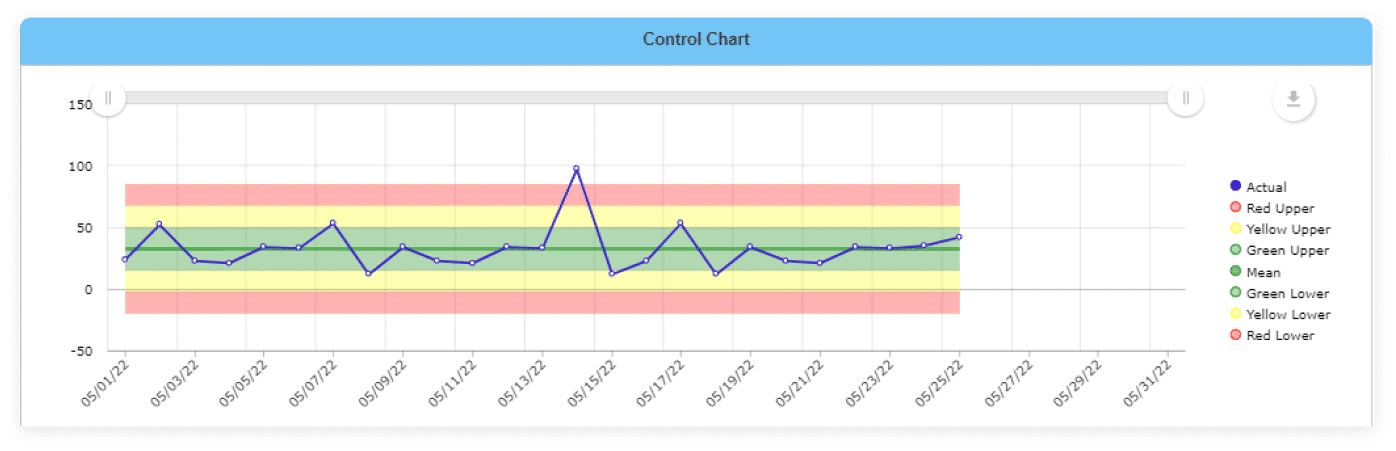
The point outside the upper control limit is a signal that the team should investigate rather than simply react to every normal fluctuation.
This is an important distinction.
The question isn’t:
“Did the number change?”
The question is:
“Is this change statistically unusual enough to investigate?”
KPI Fire identifies four patterns that can signal an out-of-control condition, including a point outside the 3-sigma limits, certain patterns beyond the 2- or 1-sigma limits, and eight consecutive points on the same side of the center line.
SmartCharts also use statistical analysis to help teams distinguish normal variation from signals that may require action.
Don’t Confuse Movement With Improvement
This is one of the biggest traps in KPI management: A KPI changes. Someone celebrates. A new initiative gets credit.
But if the underlying process hasn’t actually changed, the organization may be taking credit for something that was going to happen anyway.
The opposite can happen too.
A team implements a genuinely effective improvement, but the metric temporarily moves in the wrong direction because of normal variation.
If leaders react to every short-term fluctuation, they can end up abandoning good improvements—or continually “fixing” processes that aren’t actually broken.
That’s not continuous improvement. That’s tampering with the process.
A strong continuous improvement program needs more than a collection of metrics. It needs a structured approach for setting goals, measuring results, identifying problems, and using data to guide improvement efforts. KPI Fire’s guide to building continuous improvement programs explores how these pieces work together.
So What Does a Real Improvement Look Like?
Suppose your team implements a project designed to reduce defects.
The defect rate drops immediately afterward.
That’s encouraging—but the first question shouldn’t be:
“How much did we improve?”
It should be:
“Did the process actually change?”
If the results remain within the process’s previous range, you may simply be seeing normal variation.
But if performance shifts and establishes a new, sustained range, you have much stronger evidence that the process has actually changed.
KPI Fire demonstrates this concept with a Control Chart showing performance improving and establishing a new range.
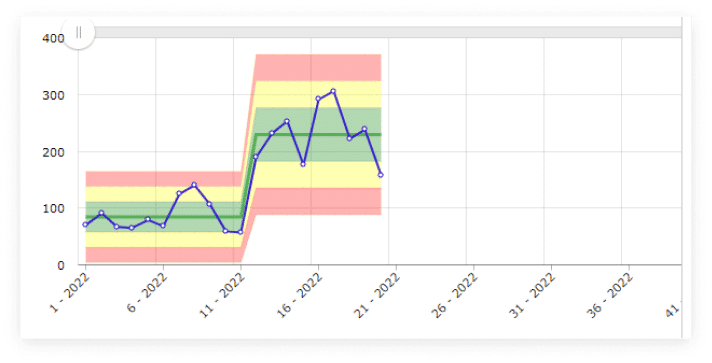
After an improvement, the process can establish a new range of normal performance.
This is a much more meaningful way to demonstrate improvement than pointing to a single favorable data point.
And once an improvement has been demonstrated, the work isn’t necessarily finished. Teams need to continue monitoring the result to make sure the improvement holds over time. Project closure and process improvement sustainment guidance covers how teams can move key metrics into ongoing performance management and maintain gains after a project is completed.
Use Data to Decide When to Act
The goal of a Control Chart isn’t to turn every manager into a statistician.
It’s to help teams stop reacting to noise and start investigating meaningful signals.
KPI Fire automatically calculates the mean and control zones from the actual data entered for the metric.
That means teams don’t need to manually calculate limits or build a separate spreadsheet every time they want to understand process variation.
You enter the actual values.
KPI Fire takes care of the statistical work.
Your team focuses on what the data is telling you.
This approach also fits into a broader KPI management strategy: metrics shouldn’t simply be collected and reported. They should help teams understand performance, identify opportunities, and decide where action is needed.
From Signal to Improvement
The real value isn’t the chart itself.
It’s what you do with the signal.
When a Control Chart indicates that something unusual may be happening, ask:
- What changed?
- When did it change?
- What happened in the process at that time?
- Is there a special cause we can identify?
- Is the change desirable?
- Can we reproduce it?
- If it’s an improvement, how do we sustain it?
That’s where measurement connects to continuous improvement.
Metric → Signal → Investigation → Improvement → Sustained Results
Instead of reacting to every wiggle in the data, your team can focus its energy on changes that are actually worth investigating.
This creates a stronger connection between metrics and improvement work: measure performance, identify meaningful signals, investigate the cause, and take action.
Stop Chasing Noise. Start Finding Signals.
Continuous improvement isn’t about making the chart look better every week.
It’s about understanding the process well enough to know when you’ve actually changed it.
The next time a KPI moves in the right direction, don’t immediately declare victory.
Ask whether the process changed—or whether the data just moved.
A Control Chart can help you tell the difference.
See Control Charts in Action
KPI Fire lets you configure a metric as a Control Chart and automatically calculate the mean and statistical zones from your actual data.
Request a Demo to see how KPI Fire can help your team separate real improvement from normal variation.