
Most organizations have no shortage of metrics.
The harder question is whether they are measuring the results they achieved or the actions that are likely to produce those results.
That is the fundamental difference between lag measures and lead measures.
Both are important. But they serve very different purposes.
If you rely only on lag measures, you may know whether you won or lost—but not early enough to change the outcome. If you focus only on lead measures, you may stay busy without knowing whether all that activity is actually producing results.
The best performance management systems use both to turn data into smarter ways to monitor progress.
What Is a Lag Measure?
A lag measure tells you what has already happened.
It measures an outcome or result after the activities that influenced it have taken place.
Common examples include:
- Revenue
- Profit margin
- Customer satisfaction scores
- Production output
- Scrap rate
- Employee turnover
- Hospital readmission rates
- Website conversions
Lag measures are usually the metrics executives care most about because they represent the ultimate result the organization wants to achieve—such as key financial and strategic KPIs.
The challenge is that by the time a lag measure changes, much of the work that caused the result has already happened.
Think of a lag measure as the scoreboard.
When a basketball team looks at the scoreboard, it knows whether it is winning. But staring harder at the scoreboard will not improve the score.
The team has to change what it is doing on the court.
That is where lead measures come in.
What Is a Lead Measure?
A lead measure tracks an activity, behavior, process, or condition that is expected to influence a future result.
Good lead measures generally have two characteristics:
Predictive: When the lead measure improves, the desired outcome is more likely to improve.
Influenceable: The team responsible for the result can directly affect the measure through its actions.
For example, a sales organization may have a lag measure of:
Monthly revenue.
Potential lead measures could include:
- Qualified sales opportunities created
- Discovery meetings completed
- Proposals delivered
- Follow-up activities completed
- Pipeline coverage ratio
Revenue is the result.
Those activities help create the result.
🎬 Visual Guide: Lead vs. Lag Indicators Explained
Want a 3-minute visual walkthrough of how leading indicators predict lagging outcomes before it’s too late? Check out KPI Fire Founder Cedro Toro’s explanation:
Lead vs. Lag Measures at a Glance
| Lead Measure | Lag Measure | |
|---|---|---|
| Focus | Activity or process | Outcome or result |
| Timing | Before the final result | After the result |
| Purpose | Influence future performance | Evaluate past performance |
| Control | Usually highly influenced | Often less directly controllable |
| Example | Preventive maintenance completed | Machine downtime |
| Management Question | What should we do? | How did we do? |
Neither is inherently better on its own.
A useful visual management system connects the two.
Lead measures tell you where to act. Lag measures tell you whether those actions worked.
Manufacturing Example: Downtime
Imagine a manufacturing plant trying to improve equipment reliability.
The leadership team establishes a goal:
Reduce unplanned machine downtime by 20%.
Lag Measure
The obvious lag measure is:
Hours of unplanned downtime
That is an important metric. Ultimately, management needs to know whether downtime is actually decreasing.
But waiting until the end of the month to look at downtime provides relatively little opportunity to influence the result.
Instead, the team might identify lead measures such as:
Percentage of preventive maintenance completed on time
- Number of equipment inspections completed
- Percentage of identified maintenance issues resolved before failure
- Mean time between scheduled inspections
- Operator autonomous maintenance checks completed
A KPI hierarchy might look like this:
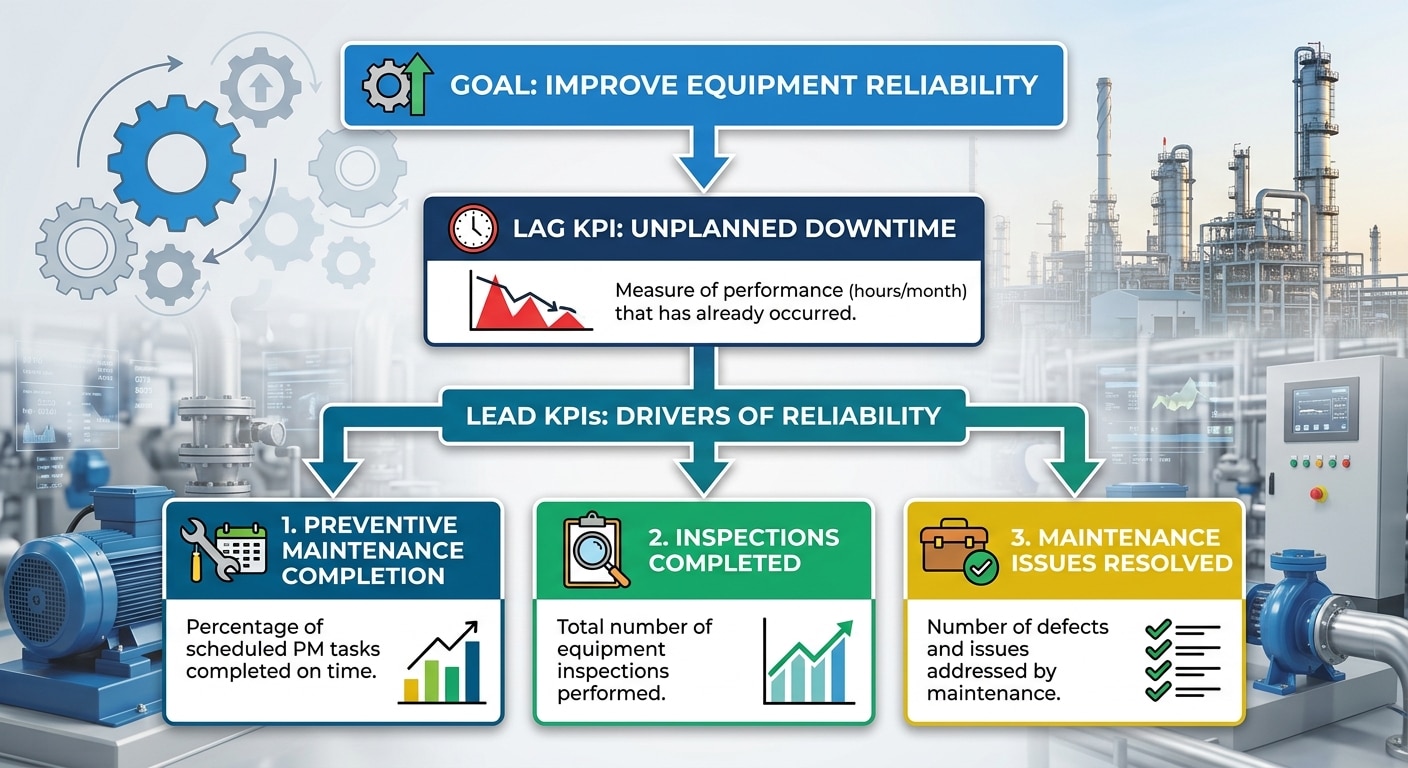
Now the team has both a scoreboard and something it can act on.
When operational constraints or equipment bottlenecks arise, combining predictive lead metrics with frameworks like the Theory of Constraints helps pinpoint exact clogs in your systems vs. processes before machine reliability drops.
Sales Example: Revenue
Sales teams frequently make the mistake of managing almost entirely through lag measures.
They look at:
-
-
- Revenue
- Bookings
- Closed deals
- Average contract value
-
Those metrics are essential—but salespeople cannot directly perform an activity called “generate revenue.”
Revenue comes from a sequence of activities.
Consider a SaaS company with a quarterly sales target of $2 million in new bookings.
Lag Measures
-
-
- New bookings
- Revenue
- Closed-won opportunities
- Win rate
-
Lead Measures
Possible lead measures include:
-
-
- New qualified opportunities created
- Discovery calls completed
- Product demonstrations completed
- Proposals sent
- Pipeline value
- Opportunities with confirmed next steps
-
You can even connect several measures into a funnel:
Outbound activity → Meetings → Qualified opportunities → Proposals → Closed deals → Revenue
As you move from left to right, the measures generally become increasingly “lagging.”
That distinction is important because lead and lag are often relative rather than absolute.
For example: A product demo is a lag measure of prospecting activity.
But it is a lead measure for a proposal.
A proposal is a lag measure for sales activity that came before it.
But it is a lead measure for revenue.
This is one reason organizations should avoid arguing too much about whether a metric is technically a lead or lag indicator.
The more important question is: What result does this metric help us predict or influence?
Marketing Example: Lead Generation
Suppose the marketing team has a goal of increasing qualified leads.
Lag Measures:
The team might track:
-
-
- Marketing-qualified leads
- Sales-qualified leads
- Pipeline generated
- Customer acquisition cost
- Marketing-sourced revenue
-
Those outcomes tell the team whether its marketing efforts ultimately worked.
Lead measures:
-
-
- New content published
- Landing page conversion rate
- Campaigns launched
- Email click-through rate
- Webinar registrations
- Paid advertising click-through rate
- Target accounts engaged
-
For example:
Marketing activities → Website traffic → Conversion rate → Leads → Opportunities → Revenue
Revenue is clearly a lag measure.
But website traffic could be considered a lag measure for SEO activity and a lead measure for future conversions.
Again, the relationship is what matters.
A strong marketing dashboard lets the team trace results backward.
If leads decline, is the problem:
-
-
- Lower traffic?
- Lower conversion rates?
- Poor lead quality?
- Fewer campaigns?
- Reduced advertising?
- Changes in search rankings?
-
A dashboard containing only “leads generated” may show the problem without helping diagnose it.
Healthcare Example: Patient Re-admissions
Healthcare provides another useful example.
Suppose a hospital wants to reduce 30-day patient re-admissions.
Lag Measure
30-day readmission rate
This is an important outcome, but it cannot be directly changed once the patient has already been readmitted.
The hospital therefore needs to identify behaviors and processes that may reduce the likelihood of readmission.
Lead Measures
These might include:
-
-
- Percentage of patients receiving discharge education
- Percentage of medications reconciled before discharge
- Follow-up appointments scheduled before discharge
- High-risk patients contacted within 48 hours
- Percentage of patients receiving post-discharge follow-up calls
-
The relationship might look like:
Discharge process compliance → Follow-up care → Patient adherence → Readmission rate
The readmission rate tells leadership whether the system is working.
The process measures give healthcare teams something they can improve today.
The Most Common Mistake: Measuring Only Results
Many executive dashboards are dominated by lag measures.
They contain metrics such as:
-
-
- Revenue
- EBITDA
- Customer satisfaction
- On-time delivery
- Quality
- Market share
- Employee turnover
-
Those are all important measures.
But imagine running a football team by telling the players:
“Our goal is to score 30 points.”
That is a perfectly reasonable outcome.
But the players still need to know what behaviors are expected to produce it.
Organizations need the same connection.
For every important lag measure, ask: What processes or behaviors drive this result?
Then determine whether those activities can be measured.
The Opposite Mistake: Measuring Activity Without Results
The opposite problem is also common.
Organizations sometimes create enormous lists of activity metrics:
-
-
- Calls made
- Meetings attended
- Tasks completed
- Reports submitted
- Training completed
-
But activity alone does not equal performance.
A salesperson could make 100 calls a day without producing qualified opportunities.
A marketing team could publish 20 articles without generating meaningful traffic.
A maintenance department could complete hundreds of inspections without reducing equipment failures.
This is why lead measures should always be connected to lag measures.
Ask: Does improving this activity actually improve the result we care about?
If the answer is unclear, the measure may simply be tracking busyness.
How to Choose a Good Lead Measure
When selecting lead measures, consider four questions.
1. Is It Predictive?
Does improvement in this measure increase the likelihood of achieving the desired result?
For example: Preventive maintenance completion is likely to influence equipment reliability.
Number of internal emails sent probably is not.
2. Can the Team Measure It?
A team should be able to take action that changes the measure.
A sales representative can influence:
-
-
- Calls
- Meetings
- Follow-ups
- Opportunities created
-
They cannot directly control whether the economy enters a recession.
3. Can It Be Measured Frequently?
Lead measures are most useful when teams can review them frequently enough to adjust behavior.
Weekly or even daily monitoring may be appropriate.
Lag measures are often reviewed monthly or quarterly.
4. Is It Connected to an Important Outcome?
Every lead measure should ultimately connect to a meaningful business outcome.
If you cannot explain how an activity contributes to a strategic objective, ask whether it belongs on the dashboard.
A Simple Framework for Building Better KPIs
A useful way to develop KPIs is to work backward from the desired result.
Start with the question:
1. What result do we want?
Example:
Reduce customer complaints by 25%.
That becomes the lag measure.
Then ask:
2. What causes or influences that result?
Possible factors might include:
-
-
- Product defects
- Shipping errors
- Response time
- Training
- Process adherence
-
Next ask:
3. Which of those factors can our team influence?
Perhaps the team can directly control:
-
-
- Quality inspections
- Standard work compliance
- Employee training
- Response times
-
Finally ask:
4. What can we measure frequently?
Those become potential lead measures.
The structure becomes:
Objective → Lag Measure → Performance Drivers → Lead Measures → Improvement Projects
This framework forms the bedrock of holistic strategic systems like The Balanced Scorecard Framework, allowing you to balance financial outcome metrics with internal process lead measures.
Lead and Lag Measures in Continuous Improvement
Lead and lag measures are especially powerful when combined with continuous improvement.
A lag measure identifies the performance gap.
A team can then investigate the causes of that gap and develop improvement projects.
Those projects change processes.
Lead measures monitor whether the new behaviors or processes are being implemented.
Lag measures then determine whether the changes actually improved performance.
The cycle becomes:
Measure → Identify Gap → Improve Process → Monitor Lead Measures →
→ Evaluate Lag Measures → Repeat
This is why KPI management and continuous improvement should not operate as separate systems—they are core pillars of a healthy continuous improvement culture.
To cascade these lead and lag relationships cleanly across departments, many strategic leaders map them using a visual deployment method like the Hoshin Kanri X-Matrix or Hoshin Planning Framework.
Using KPI Fire to Connect Lead and Lag Measures
KPI Fire helps organizations connect strategic goals, KPIs, and improvement work in one system.
Rather than simply reporting that a KPI is red, teams can connect performance problems to the projects and actions intended to improve them.
For example:
Strategic Goal: Improve Operational Reliability
Lag KPI: Unplanned Downtime
Lead KPIs:
-
-
- Preventive Maintenance Completion
- Equipment Inspection Compliance
- Corrective Actions Completed
-
Improvement Projects:
-
-
- Improve preventive maintenance scheduling
- Implement operator inspection standards
- Reduce repeat equipment failures
-
This creates visibility from the strategic outcome all the way to the work being performed to improve it.
Instead of asking only:
“Are we hitting the target?”
leaders can also ask:
“Are we doing the things that should move the target?”
That is a much more powerful management conversation.
Final Thought: Manage the Drivers and Measure the Results
Lag measures tell you whether you reached your destination.
Lead measures tell you whether you are heading in the right direction.
Effective organizations use both.
Use lag measures to define success and evaluate results.
Use lead measures to manage the behaviors, processes, and activities that influence those results.
And most importantly, connect the two.
When teams can see the relationship between their daily work and the outcomes the organization is trying to achieve, KPIs stop being numbers on a dashboard.
They become tools for driving continuous improvement.
Ready to Connect Strategy, KPIs, and Execution?
Managing lead and lag metrics shouldn’t mean drowning in disconnected spreadsheets or static slide decks. KPI Fire gives your leadership and operational teams real-time visibility into the metrics that matter—and the projects driving them.
👉 Request a Demo of KPI Fire to align your team, track performance drivers, and execute continuous improvement goals.