
How to Set Up a Metric in KPI Fire
Related Resources:
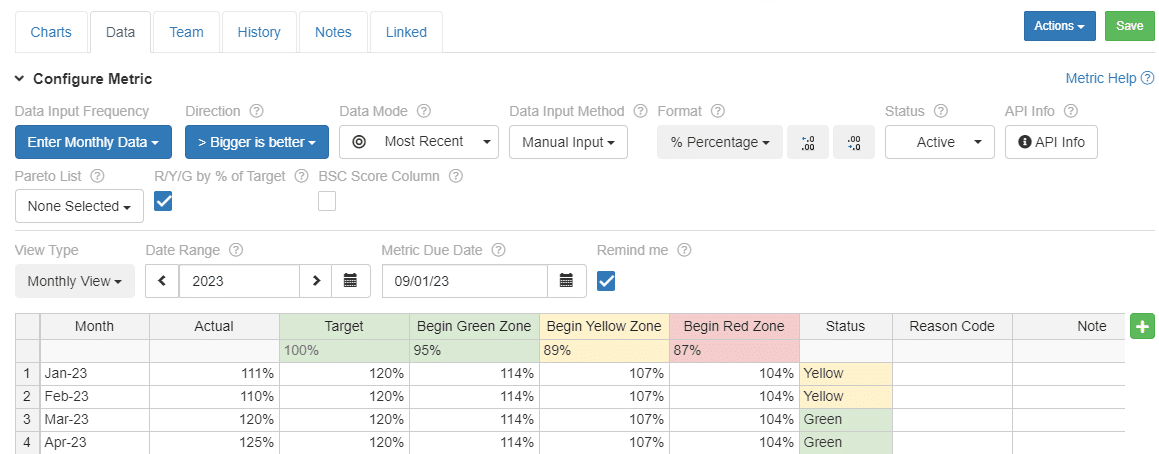
Configuration Options:
- Data Input Frequency
- Direction
- Data Mode
- Data Input Method
- Format
- Decimals
- Status
- API Info
- Pareto List
- R/Y/G by % of Target
- BSC Score aka “Balanced Scorecard” Score
- View Type
- Date Range
- Metric Update Reminder
- Actual, Target, Begin Green Zone, Begin Yellow Zone, Begin Red Zone
- Custom Columns
- Lock
Data Input Frequency
Select an input frequency that best matches how often the data will be recorded. Metrics require the same input frequency when creating parent/submetric relationships in order to enable data roll-up. View type options are limited by the frequency input; cannot select a view type smaller than the input frequency.
- Hourly: 24 entries per day
- Daily: 28-31 entries per month
- Weekly: 52-53 entries per year
- Monthly: 12 entries per year
- Quarterly: 4 entries per year
- Yearly: 1 entry per year
- Custom: Enter Date & Time of entry. Great for recording “as they happen” events such as defects.
The data table will adjust based on the input frequency selected in order to enter data. To view the data in different intervals toggle the view type.
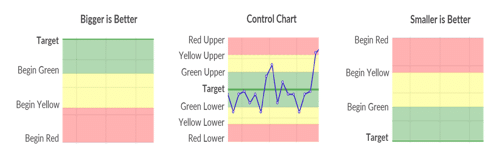
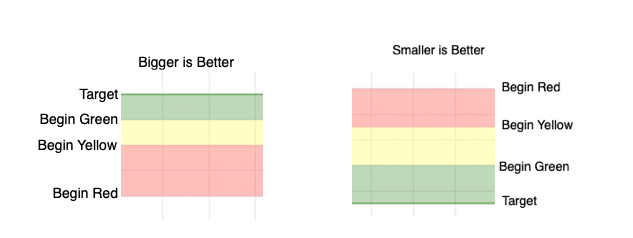
Direction
Status color for data is determined by direction selection.
- > Bigger is Better – Use for metrics like Revenue or Productivity.
- < Smaller is Better – Use for metrics where smaller numbers are better like accidents/injuries.
- = Control Chart: Use when a middle zone is best, or when tracking a process performance. (more info)
Example: Actual: 50, Target: 100
- > Bigger is Better: Status = Red
- < Smaller is Better: Status = Green
Data Mode
- Sum (Through current period), Sum (All periods), Average, Most Recent
The data mode affects calculations represented in the charts tab and how data will roll-up if the view type is larger than the input frequency.
Data Input Method
Note: In order to roll-up sub metric data, all metrics must have the same data input frequency.
- Manual: for manual input or api input
- Sum sub metric data: Calculate this metric by summing specified metrics
- Ratio: Calculate this metric by dividing one metric by another metric
- Sum Project Benefit Account: Calculate this metric from specified project benefit accounts. (Must be monthly frequency)
Format
- # Number, % Percentage, $ Currency
- Decimals
Formatting will affect how the metric’s data is displayed in the data table, charts, and all views.
Status
- Active
- Archive // Metric will not show up in regular use. Archived metrics can be found in Advanced Search>>metrics: toggle Include Archives.
To Archive metrics in bulk: Use the export option on metric tile view. Update the status from Active to Archive in the csv file, then use the import metric option.
API Info
Each metric has a unique metric ID. This value can be identified in API Info button.
Additional Information about available KPI Fire APIs can be found here
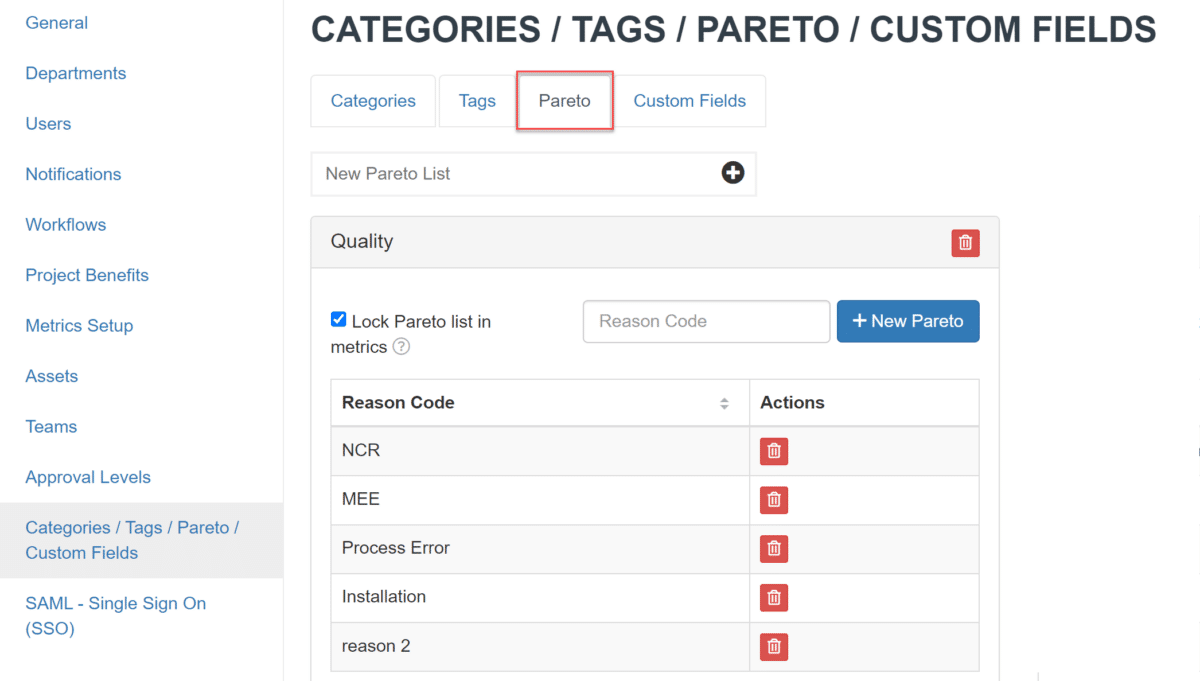
Pareto List
Choose an existing Pareto list to enable reason code selection in the data table. Pareto lists can be created and managed from the settings area.
Pareto charts rely on data in the “reason code” column to display.
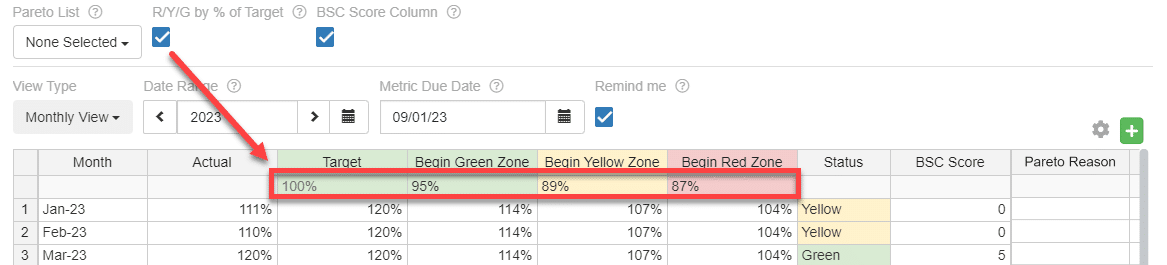
R/Y/G by % of Target
- If checked, this feature will enable a formula to calculate metric zones from % of Target values.
- Note: for Data Input Method = Manual (only as of March 2023)
View Type
- Hourly, Daily, Weekly, Monthly, Quarterly, Yearly, 5 Year
Select a view type to toggle how the data is displayed in the charts and data tabs. Data is only editable when the view type selected is the same as the data input frequency. View types are limited by the input frequency of the metric; example: a monthly input frequency cannot be displayed in a daily view.
Date Range
- Toggles the data being displayed for the metric based on the date selected
Metric Update Reminder
Check “Remind Me” to show this metric on the user’s daily update page when the metric due date has arrived or is past due.
Data Table
- Actual – real values that are recorded
- Target – forecasted value that is calculated against the actual to determine % of totals
- Begin Green Zone, Begin Yellow Zone, Begin Red Zone – begin zone values are used to set ranges for the three zones of status color indicators
Note: If only red/green indicators are desired, then only use the actual and target values
Lock
- Lock icon on Team Tab can be used to restrict editing of the Metric configuration and targets
- Only Admin License user can lock/unlock metrics.
- Team Members with Edit or Owner role will still be able to update Actual, pareto reason, notes and custom columns
BSC Score aka Balanced Scorecard
- This option enables an auto-calculated score that can be used with the Balanced Scorecard Huddleboard
- Values calculated based on BSC Score table in Main Settings area (Admin user only)
How are Percent Complete Calculations determined?
- Bigger is Better % complete = Actual / Target
- Smaller is Better % complete = (Actual – Begin Red) / (Target – Begin Red)
Link a Metric
Use the Actions drop down to Add/Edit linked Metrics. The metric open can be converted into a parent metric that takes its data from linked sub metrics using the data input method options.
More Information on Metrics:

