Product Enhancements – Release Notes December 2020
We are happy to announce some new enhancements & fixes:
(Released December 21, 2020)
Note: if you don’t see the same thing in your account, try clearing your cache/cookies or use a “new private window” to refresh the cache.
User Profile Page:
- View the date of the latest software update release

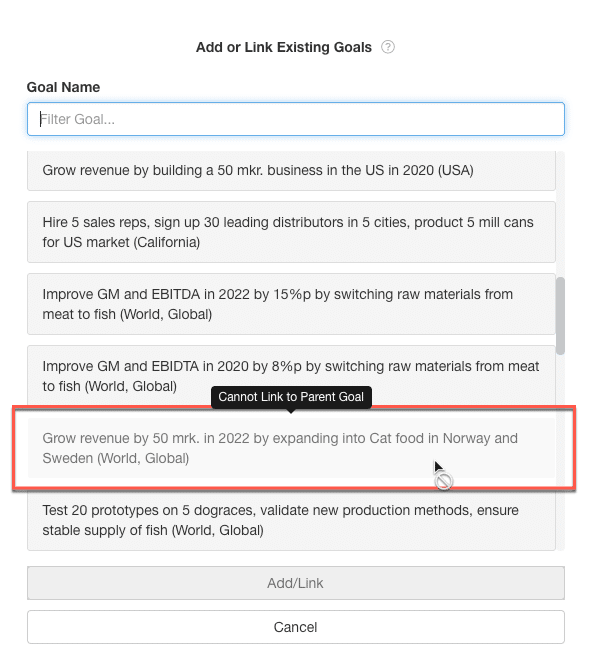
Goal Linking Modal:
- New conditional formatting to prevent linking a child goal to a second-level parent goal
Team Engagement Report:
- Updated Report Tile: NEW Average Value of a Project: Actual Total Benefit / # of Projects with Actual Benefit Value
- Total Benefit values are taken from all filtered projects with active, complete, or control status

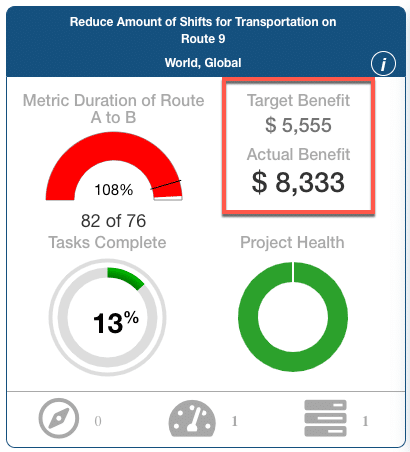
Goal Tiles:
- Updated UI: Benefit to reflect Target and Actual values
Metric Modal:
- Enhanced Print Feature for Metric Charts and Data tabs

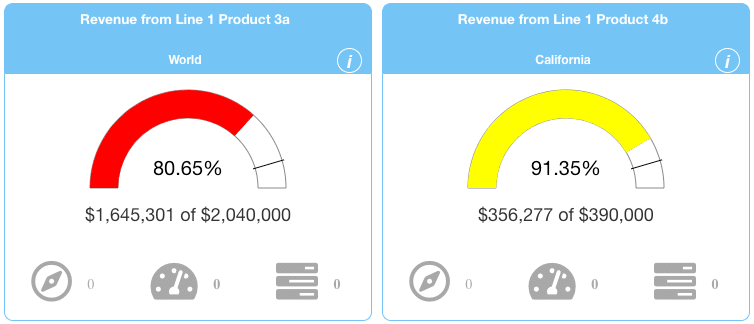
Metric Gauge Chart:
- Gauge Chart shows actual percentage of target in first line, inside the gauge chart. The second line defines the actual and target values.
- UI change only, no changes made to the data values displayed.
Custom Dashboard:
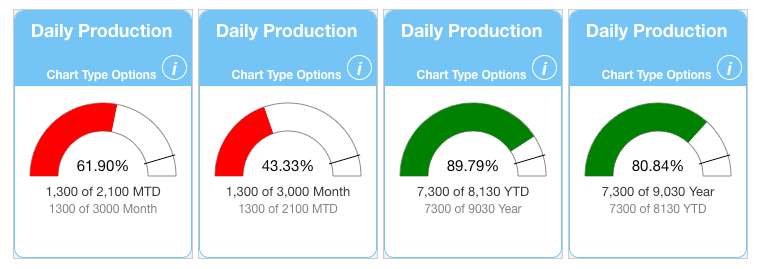
- Metric Tiles UI Update: Sum (All Periods) and Sum (Through Current Period) changed to Sum (All) and Sum (To Date). The calculations for the data modes are unchanged.
- Sum tiles show both calculations (Sum (All) and Sum (To Date)) for the metric. Select the primary data mode that will be represented by the gauge chart and the secondary sum values will be displayed in grey text beneath.
Metric Bowling View:
- Date selector remains at top of view when scrolling
- Filtered count added to top of page


API’s:
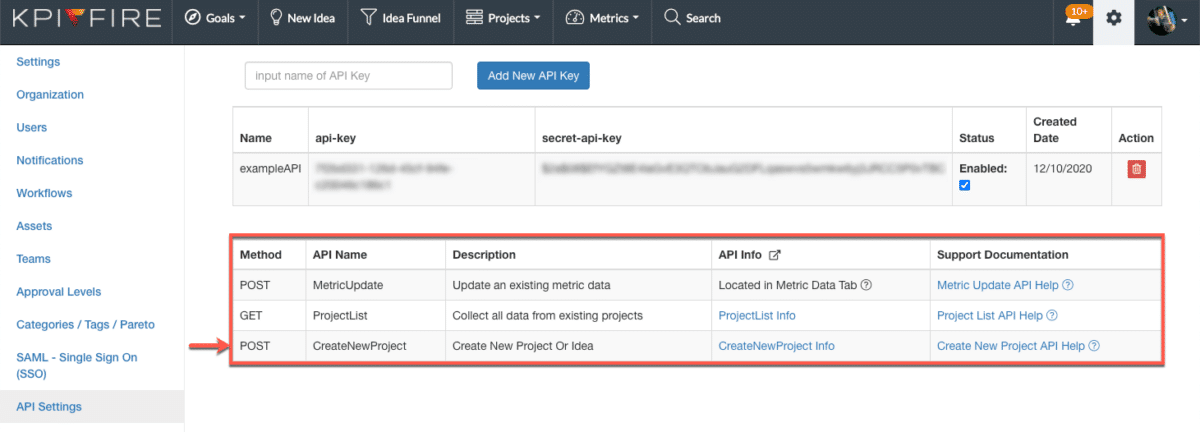
- Settings –> API Settings
- Updated UI
- NEW CreateNewProject API: use to import new project data
Project Tabs:
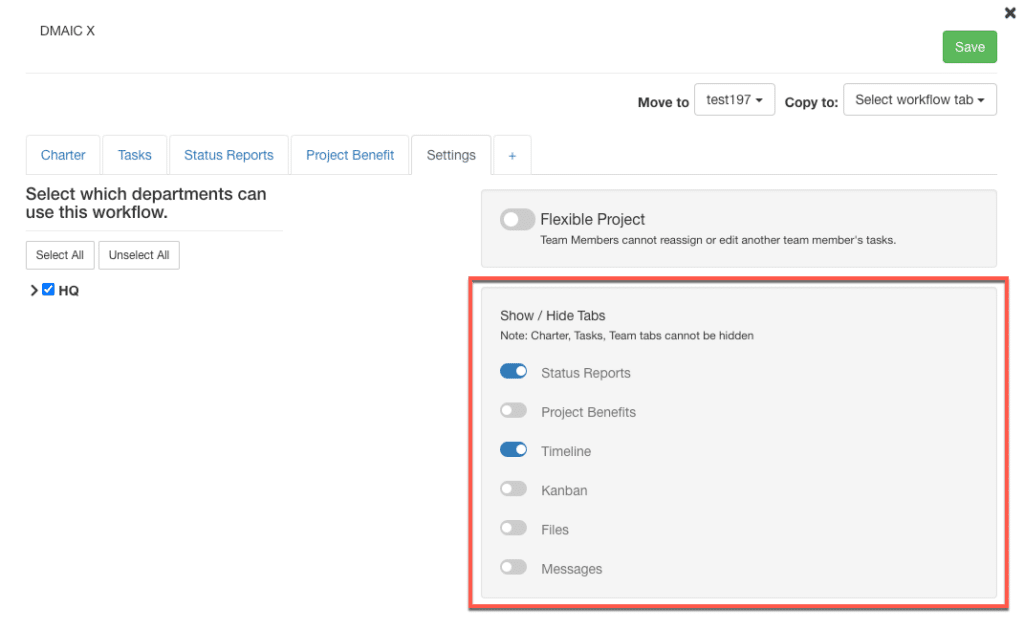
- Workflow –> Settings: Show/Hide Tabs
- Customize which tabs in a project will show in the main tab headers or hide in the dropdown menu
- Charter, Tasks, and Team Tabs cannot be hidden
- By default, Status Report and Project Benefits are set to “show”
- Changes that are made to the Workflow settings will automatically update to all projects with that workflow. Do not need to merge or replace project workflows in order to update changes made to the workflow settings.

Custom Dashboard:
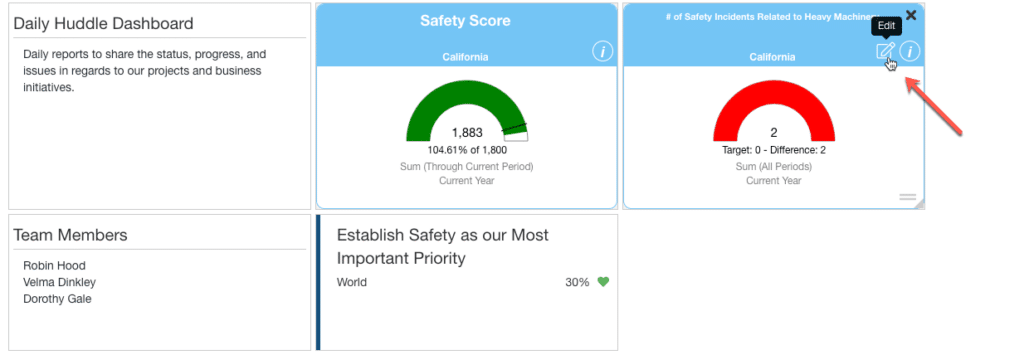
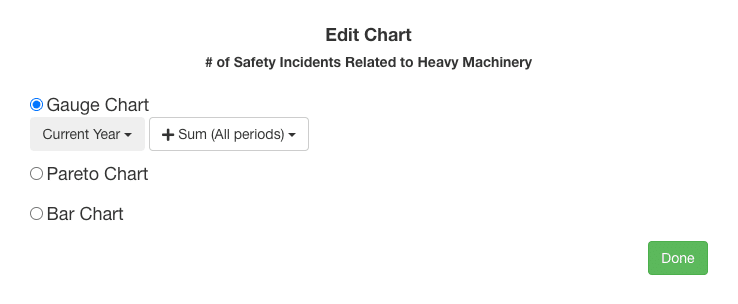
- Metric Tiles: Edit Mode
- Change the configurations of an existing chart on a dashboard.
Project Tasks:
- Task Due Date: color changes to grey when complete
- Due Date Formatting:
- Black- not done, not overdue
- Red- not done and past due
- Grey- done

<< Previous Release Notes: Q4:November 2020
>> Next Release Notes: Q1: January 2021


